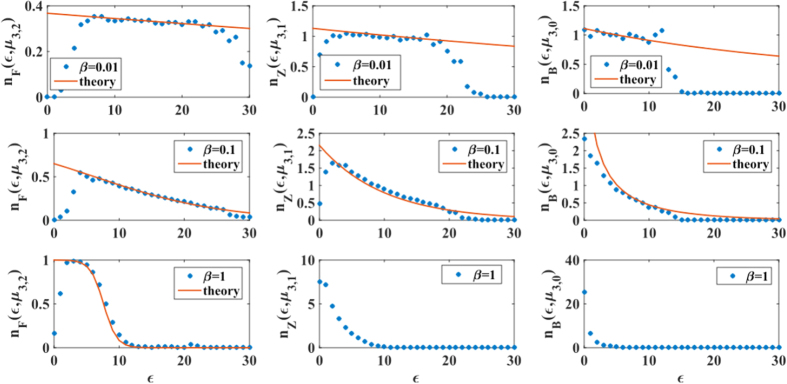
Figure 4. In d = 3 the average of the generalized degrees of faces, links, and nodes follow respectively the Fermi-Dirac, Boltzmann and Bose-Einstein distributions.

The average of the generalized degrees of  -faces of energy
  , in a CQNM of dimension d=3, follow the Fermi-Dirac
  , the Boltzmann
  or the Bose-Einstein distribution
  according to Eqs. (23)–(25), , as long as the chemical potential
  is well-defined, i.e. for sufficiently low value of the inverse temperature β. Here we compare simulation results over CQNM of N = 103 nodes in d = 3 and theoretical results for β = 0.01, 0.1, 1. The CQNMs in the figure have a Poisson energy distribution
  with average z = 5. The simulation results are averaged over
  CQNM realizations.
