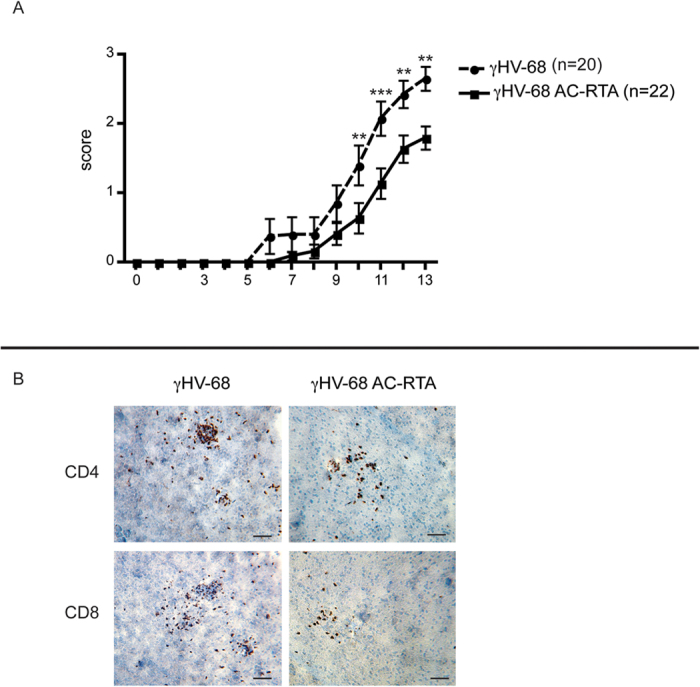
Figure 2. Mice infected with γHV-68 AC-RTA have a less severe EAE course and lower amounts of T cell infiltrations inside the CNS than mice infected with γHV-68.

Mice were either infected with γHV-68 (γHV-68 EAE, dashed line) or γHV-68 AC-RTA (γHV-68 AC-RTA EAE, solid line). Five weeks p.i., EAE was induced in both groups (day 0 on the graph). (A) The graph shows clinical scores and numbers on the x-axis indicate days post EAE induction. (B) Two weeks post EAE induction, mice were perfused, brains were harvest, embedded in OCT, snap frozen, cut and stained with antibodies specific for CD4 and CD8. The images displayed are representative consecutive sections cut from the same cerebral hemisphere of the same mouse. Scale bar: 50 μm. Four separate experiments; data are represented as mean, error bars are SEM and were analyzed with two-way ANOVA followed by Bonferroni’s post-test: **p < 0.01; ***p < 0.001.
