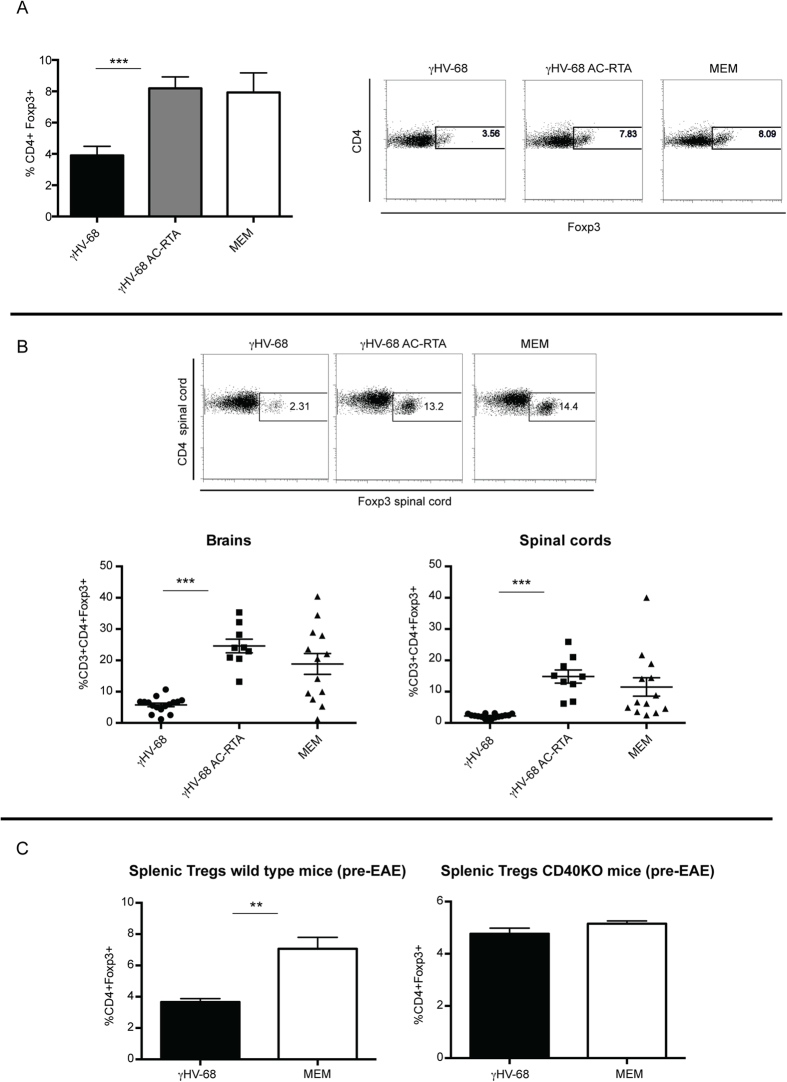
Figure 8. Regulatory T cells are decreased in spleens, brains and spinal cords of γHV-68 mice during EAE and this decrease is dependent on the establishment of latency and CD40 expression.
Mice were infected with γHV-68 (black bars-black circles) or γHV-68 AC-RTA (grey bars-black squares) or MEM only (open bars-black triangles). Five weeks p.i. EAE was induced. Two weeks post EAE induction, (A) spleens were harvested and stained for Tregs. The right panels show representative FACS plots and the graph shows the percentage of Tregs (CD4 + Foxp3+). Three separate experiments with 3 mice/group. (B) Brain and spinal cords were harvested from perfused mice and immune infiltrations were isolated. Unstimulated immune cells were stained for CD3, CD4 and Foxp3 expression. Three separate experiments with 5–6 mice/group. (C) C57Bl/6 wild type and C57Bl/6 CD40KO mice were infected with γHV-68 (black bars) or MEM only (open bars). Five weeks p.i., spleens were harvested. Unstimulated splenocytes from wild type mice (left panel) and CD40KO mice (right panel) were stained for CD4 and Foxp3 expression. Three separate experiments with 3–5 mice/group. Data are represented as mean, error bars are SEM and were analyzed with t-test: ***p < 0.001, **p < 0.01.

