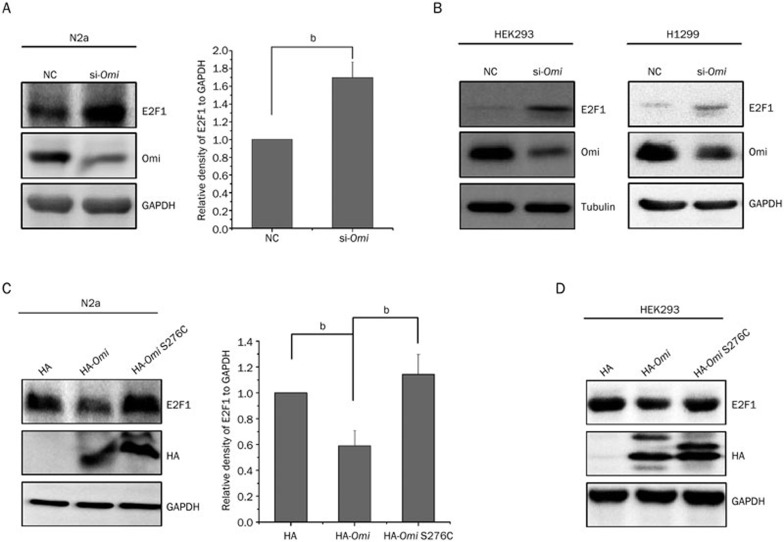
Figure 2.
Omi represses E2F1 expression dependent on its protease activity. (A) The protein level of E2F1 is increased by knocking down Omi in N2a cells. N2a cells were transfected with a control siRNA (NC: negtive control) or siRNA that targets Omi (si-Omi) for 72 h. Whole-cell extracts were prepared and immunoblotted with the antibodies indicated. The bar graph on the right shows the band intensities of E2F1 relative to GAPDH. Densitometric analyses from three independent experiments were quantified by one-way ANOVA. bP<0.05 vs NC. (B) The protein level of E2F1 is increased by knocking down Omi in both HEK293 and H1299 cells. (C) The protein level of E2F1 is decreased by transfecting HA-Omi, but not HA alone or HA-Omi S276C in N2a cells. N2a cells were transfected with plasmids encoding HA, HA-Omi, or HA-Omi S276C for 36 h. Whole-cell extracts were prepared and immunoblotted with the antibodies indicated. The bar graph on the right shows the band intensities of E2F1 relative to GAPDH. Densitometric analyses from three independent experiments were quantified by one-way ANOVA. bP<0.05. (D) The protein level of E2F1 is decreased by transfecting HA-Omi, but not HA alone or HA-Omi S276C in HEK293 cells. HEK293 cells were transfected with plasmids encoding HA, HA-Omi, or HA-Omi S276C for 36 h. Whole-cell extracts were prepared and immunoblotted with the antibodies indicated. HA: hemagglutinin.

