
Figure 2.
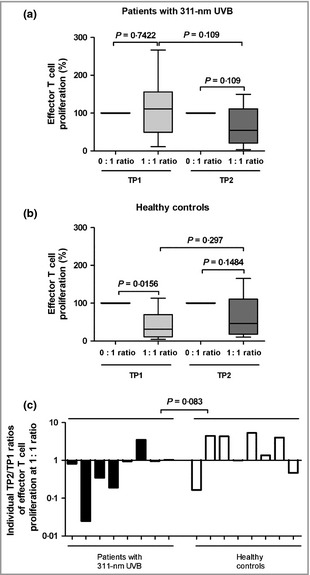
Tregs from patients with PLE have a reduced immune suppressive capacity. Treg suppression assays from (a) patients with PLE and (b) healthy controls at TP1 and TP2. Data shown are box‐and‐whisker plots (Tukey method) of proliferation rates, normalized to effector T‐cell proliferation alone (0 : 1 ratio = 100%) for patients with PLE and healthy controls. The 1 : 1 ratio represents the results of co‐culture of the same number of effector T cells (CD4+ CD25− CD127+) and Tregs (CD4+ CD25+ CD127−). (c) Individual TP2 : TP1 median ratios of T effector cell proliferation., n = 8. P‐values were determined by Wilcoxon test (a,b) and Mann–Whitney U‐test (c). PLE, polymorphic light eruption; TP1, time point 1 (before phototherapy); TP2, time point 2 (after phototherapy); Tregs, regulatory T cells.