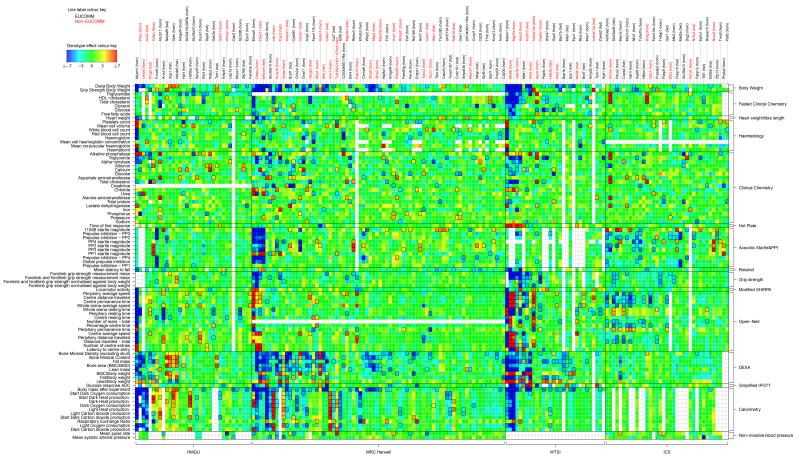
Figure 4. Heatmap of annotations of complete dataset.
Heatmap of annotations. Colours represent scaled genotype effect (posterior median / SD), with blue/red indicating a decreased/increased mutant phenotype relative to baseline animals. Significant annotations (FDR < 5%) are indicated by a black outline around the corresponding rectangle. Labels for non-EUCOMM lines are in red. For legibility, the heatmap only displays a subset of parameters for those lines with at least three annotations.

