
Fig. 3.
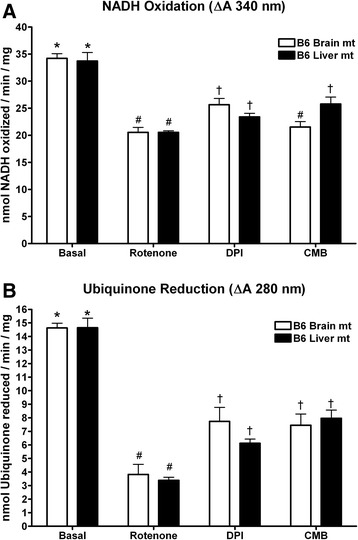
Complex I enzymatic activity is comparable in mitochondrial preparations of brain and liver mitochondria. Mitochondrial complex I enzymatic activity was assessed by following the oxidation of NADH (a) or the reduction of ubiquinone (b) by 40 μg of isolated brain or liver mitochondria. Complex I activity was measured over three minutes. Basal indicates total complex I activity in the absence of electron transport chain inhibitors. Where indicated, DPI (10 μM), CMB (10 μM), or rotenone (10 μM) was added before the initiation of the reaction. Symbols denote comparisons brain mitochondria treatment groups or liver mitochondria treatment groups, respectively, as well as comparisons between brain and liver mitochondria for each treatment. For each comparison, * vs. # < 0.01; * vs. † < 0.05; # vs. † < 0.05. For each treatment with brain mitochondria n = 6. For each treatment with liver mitochondria, n = 3