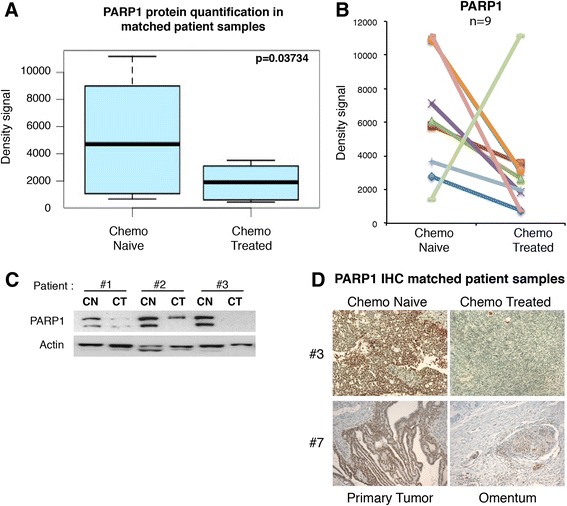
Fig. 3.

Chemotherapy decreases PARP1 protein levels in matched patient samples. a PARP1 protein levels in tumor samples from the same 15 patients before and after chemotherapy were quantified with ImageJ and the density signals obtained were used to generate a boxplot. Paired Mann–Whitney test p = 0.03734. b PARP1 density signals from nine patients with the presence of PARP1 in the tumors before receiving chemotherapy. c Representative PARP1 and actin western blot of three matched tumor samples before (CN) and after (CT) receiving chemotherapy treatment. d PARP1 immunohistochemistry (IHC) staining in tumor before and after chemotherapy treatment in the same patients (20×)
