
Fig. 6.
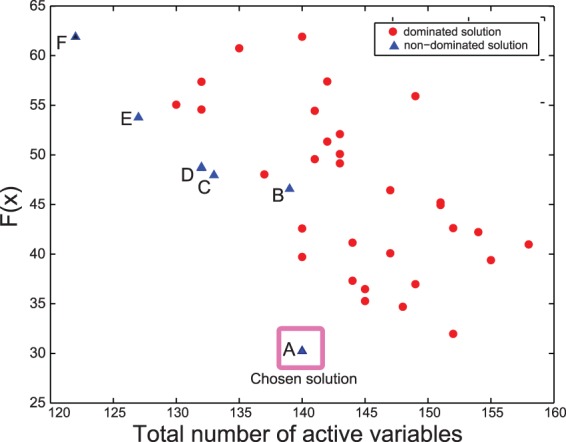
Case study 3 (HepG2): This figure shows the Pareto front for the trade-off between the goodness of fit (F ) obtained by each independent optimization run and the number of active variables (number of active binary variables plus the number of active continuous parameters), which is a proxy for model complexity. The chosen solution shows a good balance between goodness of fit (RMSE of 0.121) and complexity