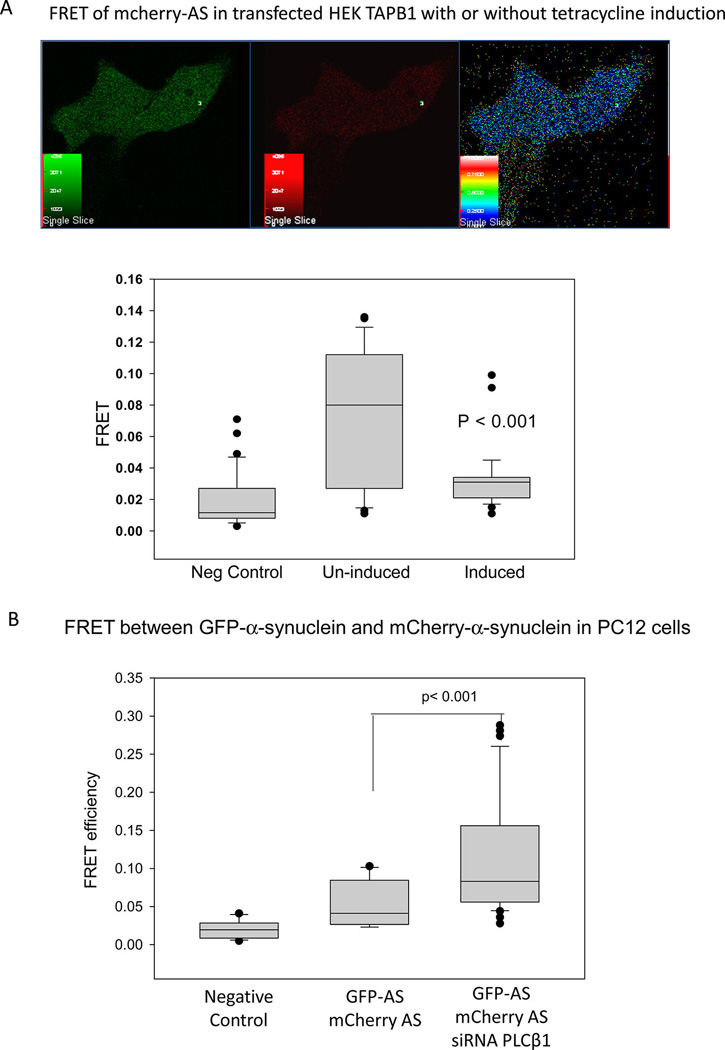
Figure 3.

PLCβ1 expression modules α-synuclein oligomerization as seen by FRET. A. Change in FRET between eGFP-α-synuclein and mCherry-α-synuclein in untreated HEK293β1 cells and in cells induced to overexpress PLCβ1. Top – An uninduced HEK293β1 cells imaged in the GFP or green (left) channel, the mCherry channel red (middle), and FRET (right) channel. The bottom graph shows the range of FRET values for free eGFP and mCherry where the mean FRET = 0.019 ± 0.003 (n = 33) (left); for eGFP-α-synuclein/mCherry-α-synuclein in uninduced HEK293β1 cells FRET = 0.076 ± 0.008 (n = 30); and HEK293β1 cells induced to overexpress PLCβ1, FRET = 0.032 ± 0.003 (n = 33). B. Change in FRET between eGFP-α-synuclein and mCherry-α-synuclein in PC12 cells where the negative control on the left is free GFP and mCherry (mean FRET = 0.020 ± 0003, n = 14); the middle sample is for GFP-α-synuclein/mCherry-α-synuclein (mean FRET = 0.052 ± 0.007, n = 17); and the right sample is for PC12 cells expressing GFP-α-synuclein/mCherry-α-synuclein that have been transfected with siRNA(PLCβ1) where FRET = 0.119 ± 0.0126 (n = 23).
