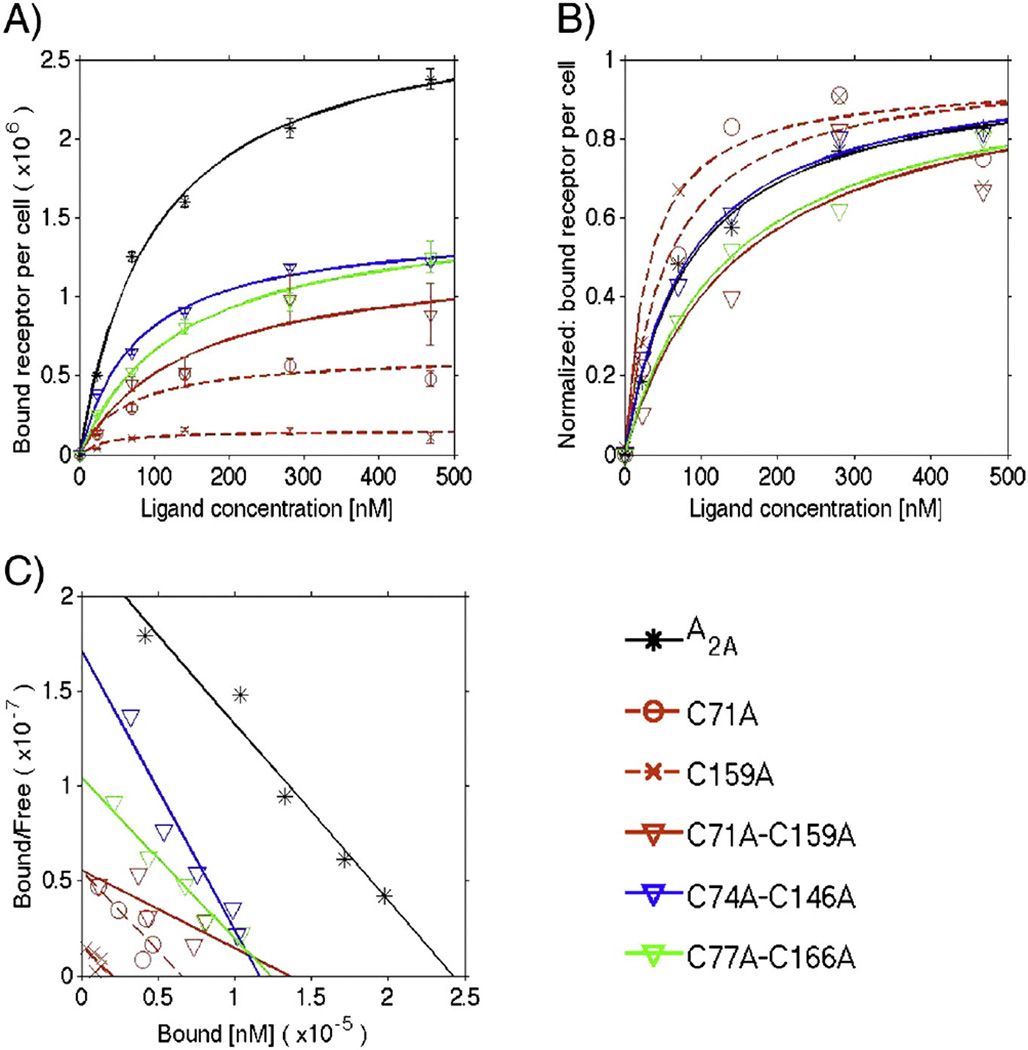
Fig. 7.
Equilibrium saturation data of [3H] CGS 21680 binding to A2AR variants expressed in HEK-293 cells. A) Monovalent binding fit: the data points are the average of at least two independent experiments performed in triplicate. The total number of active receptors per cell (Rmax) and the equilibrium dissociation constant (KD) values are displayed in Table 3. B) Normalized monovalent binding fit: data were normalized using the Rmax value. C) Scatchard analysis: the Scatchard analysis of [3H] CGS 21680 saturation binding to HEK-293 cells expressing the A2AR variants was conducted according to Scatchard [43]. For the single Cys-to-Ala variants, only C71A and C159A are plotted for clarity, and dashed lines represent the fits to the data. Data for the double Cys-to-Ala variants are plotted using downward-pointing triangles and solid lines for the fits. The data for the WT A2AR are plotted using asterisks and a black solid line for the fit.

