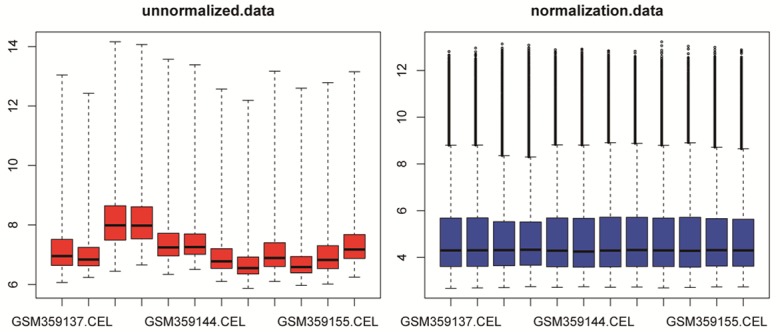
Figure 1.

Cassette figures of data distribution. The horizontal axis stands for sample names while the vertical axis represents the expression value. The black line in the cassette is the median of each data group, and the data standardization degree can be judged by its distribution. That all the black lines in the figure are almost on the same straight line reveals a good standardization degree.
