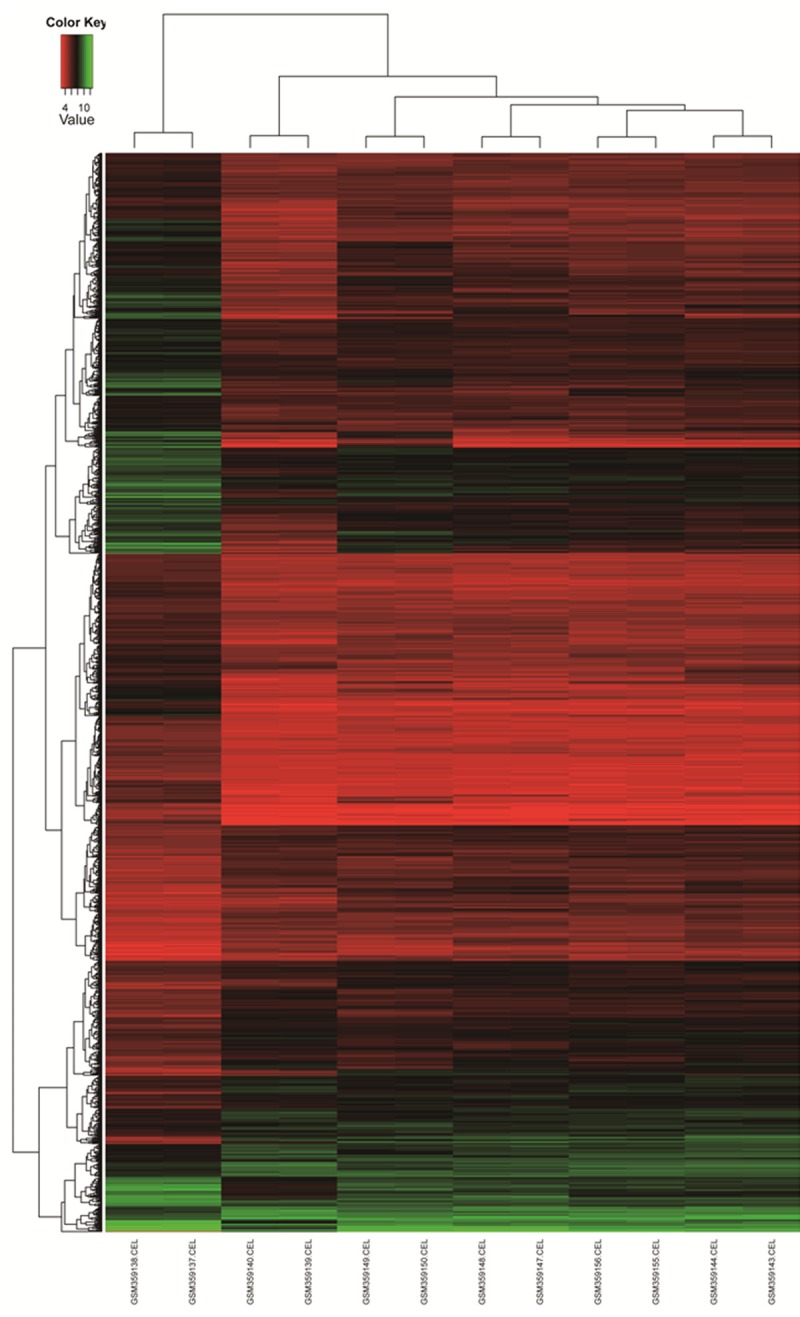
Figure 2.

Hierarchical cluster dendrogram of DEGs. The horizontal axis represents sample names. GSM359137 and GSM359138 are normal tissue samples. GSM359139, GSM359140, GSM359143, GSM359144, GSM359147~GSM359150, GSM359155 and GSM359156 are osteosarcoma samples. The left vertical axis shows clusters of DEGs, and the above horizontal axis shows clusters of samples. Red represents up-regulated genes and green represents down-regulated genes.
