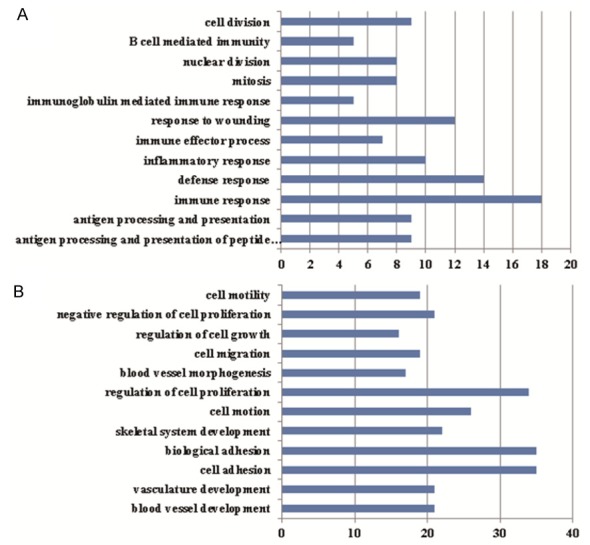
Figure 3.

Gene Ontology enrichment analyses. A. Gene Ontology enrichment of up-regulated genes of osteosarcoma; B. Gene Ontology enrichment of down-regulated genes of osteosarcoma. The horizontal axis represents the number of enriched genes. The vertical axis represents the Gene Ontology, and P values increase from bottom to top.
