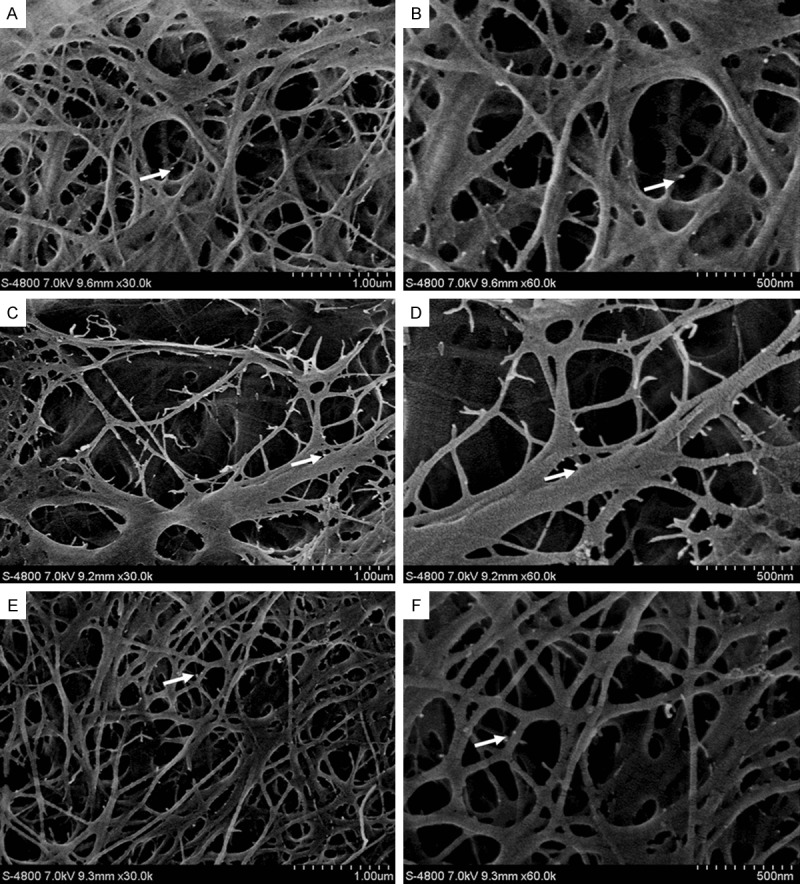
Figure 1.

Image of etched surface (FESEM images of the pretreatments on etching groups): A. PE: collagen fibers were visibly exposed with a 3D reticular structure, collagen fibers staggered in a mesh formation, and gold was a dense white dot. Gold labeling is absent in areas without demineralization (30,000×); B. amplification of PE local collagen fibrils, the 3D structure is clearly visible, gold nanoparticles are evident (60,000×); C. CE: collagen fibers exposed, collagen fibers staggered in a mesh formation, visible major collagen fibers, gold increased in secondary fibers (30,000×); D. amplification of CE local collagen fibrils, 3D structure is more clearly visible, gold nanoparticles are evident (60,000×); E. ME: collagen fibers exposed, collagen fibers staggered in a mesh formation, visible major collagen fibers, gold nanoparticles clear in secondary fibers (30,000×); F. amplification of ME local collagen fibrils, 3D structure is more visible, gold nanoparticles are clear (60,000×) (white arrows indicate gold nanopaticles).
