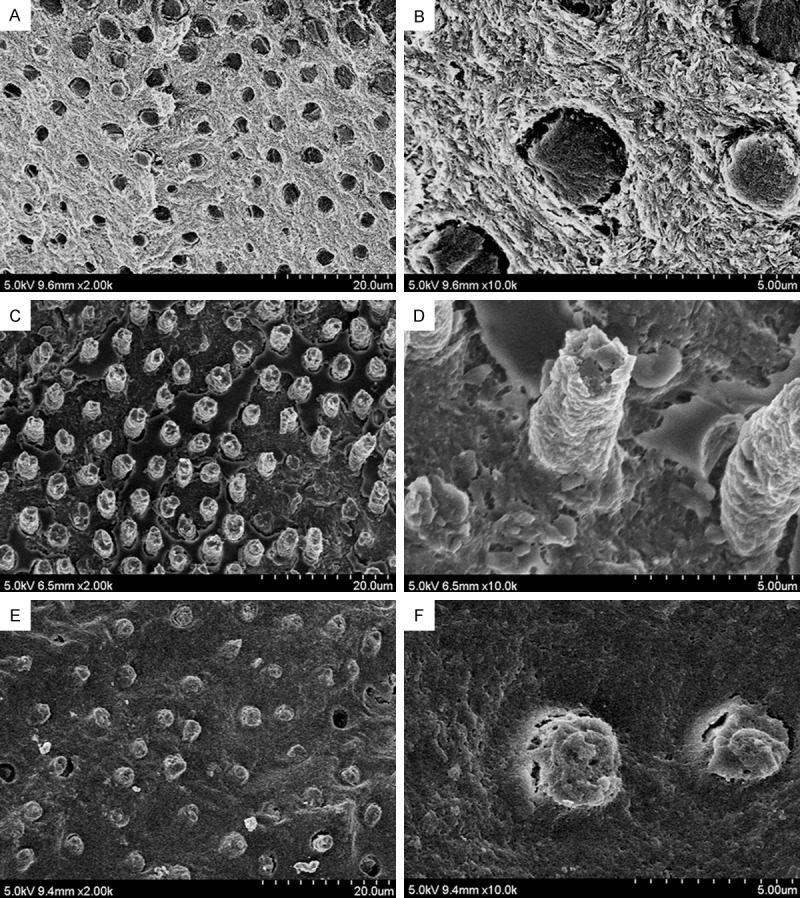
Figure 3.

Image of the resin fracture surface (FESEM images of failed interface of the resin treatment groups after force fracture): A. PR: binder covers the surface homogeneously at the bottom of the DHL (2,000×); B. PR local amplification; fractures between resin and tubular wall exist, remaining tubular resin is short, no exposed collagen fibers observed (10,000×); C. CR: binder connects to the DHL completely, much better resin infiltration into dentin tubules can be seen (2,000×); D. CR local amplification; resin is obviously thicker and longer and combined with dentin tubule, no collagen fiber exposure (10,000×); E. MR: homogeneous binder coverage, most of the tubes have resin infiltration (2,000×); F. MR local amplification; resin is thick and within tubules, with small cracks between the resin and tube wall, no exposed collagen fiber can be seen (10,000×).
