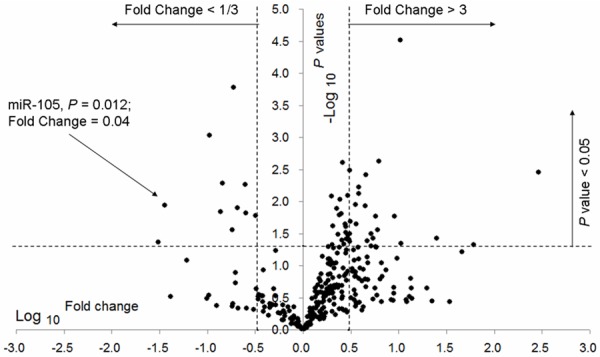
Figure 1.

A volcano plot showing the fold change in the expression 365 miRNAs between 4 GBMs and 4 AAs, detected by miRNA qPCR array analysis. The volcano plot shows the distribution of these 365 miRNAs according to their P values. The horizontal dotted line, left and right vertical dotted lines indicate P value =0.05, fold change <1/3 and >3, respectively. A set of 34 miRNAs were identified to be remarkably increased (fold change >3 and P<0.05) or decreased (fold change <1/3 and P<0.05) in GBMs versus AAs. MiR-105 had significantly lower expression in GBMs as compared to AAs (left arrow; P=0.012 and fold change =0.04).
