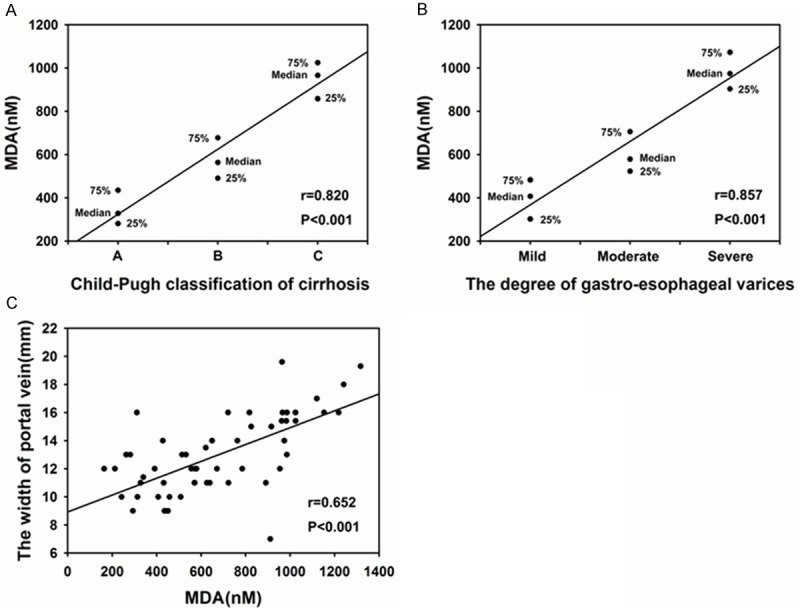
Figure 2.

Correlation of plasma MDA level with the Child-Pugh classification (A), the degree of esophageal varices (B) and the width of portal vein (C) in cirrhotic patients. Correlations between continuous parameters were assessed by using Pearson’s correlation analysis and correlations between discontinuous parameters were assessed by using Spearman correlation analysis.
