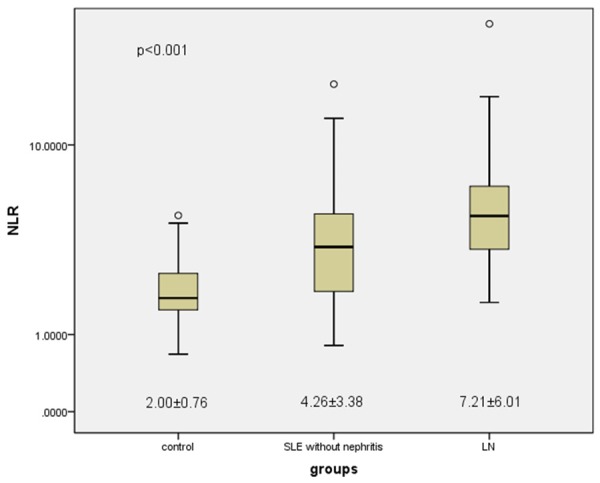
Figure 1.

Mean NLR values of the groups. The SLE without nephritis group showed significantly higher NLR than control group (control=2.00±0.76, SLE=4.26±3.38, P<0.001), and the NLR values of the patients with LN were higher than those of the patients without LN (SLE=4.26±3.38, LN=7.21±6.01, P<0.001).
