
Figure 2.
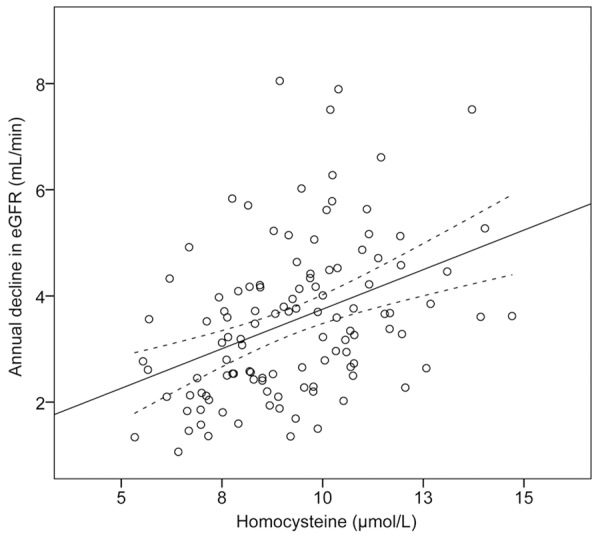
Correlation between baseline homocysteine abundance and annual decline in eGFR. Data from 157 diabetic patients included in the four years’ follow-up were graphed in the scatterplot. The linear regression line and the confidence intervals are also shown.