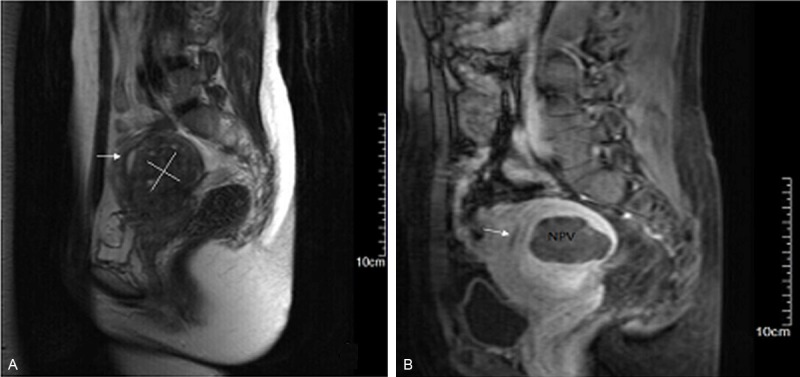
Figure 1.

Representative MRI imaging of uterine adenomyosis before and 1 week after HIFU treatment. Arrows = endometrium. A. T2WI at 2 d before HIFU. The area of the white line indicates a lesion. B. Enhanced T1WI at 1 week after HIFU. The dark shadow shows the area of lesion ablation (Non-Perfused Volume (NPV)). The percentage of NPV in this patient was 76%.
