
Figure 3.
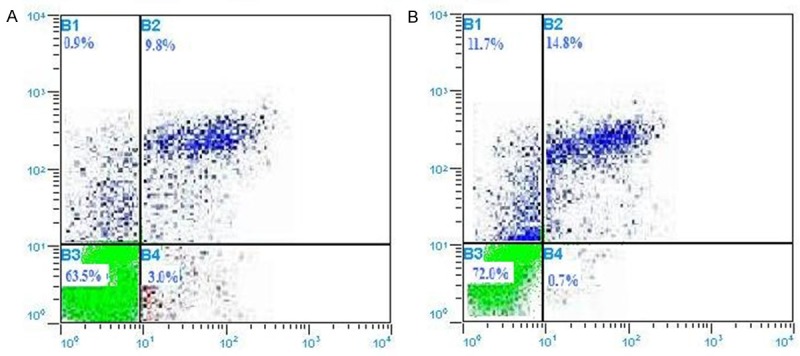
The distribution of percentages of apoptosis (A) for mice treated with adriamycin (control group); (B) for the mice treated with CA combined with adriamycin (experimental group) tested by flow cytometry. The percentages of apoptotic cells of A group (15.5±1.56) and B group (11.2±1.80) has a significant difference (P<0.05).