
Figure 6.
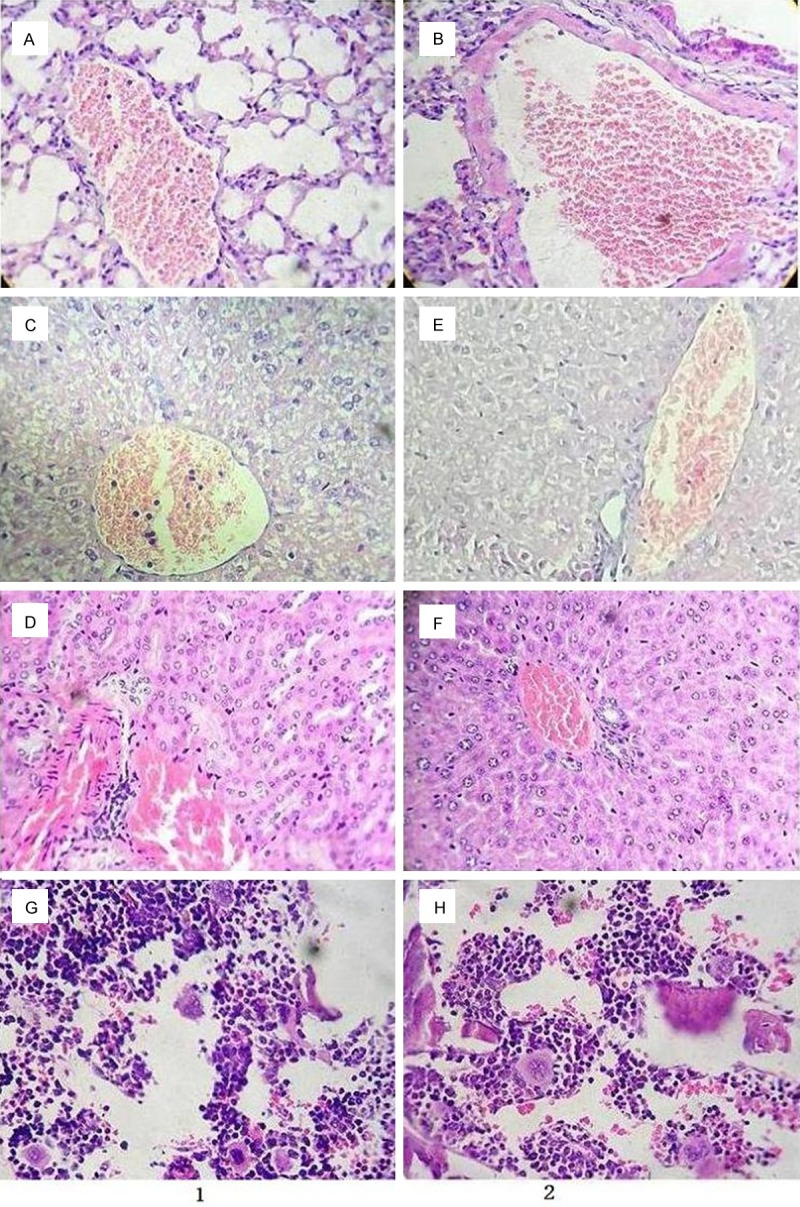
The outcome of pathological slices examination for the treatment and control groups. Note: Line 1 for the mice treated with adriamycin (control group); A: Lung; C: Liver; D: Kidney; G: Bone marrow; Line 2 for the mice treated with CA combined with adriamycin (experimental group): B: Lung; E: Liver; F: Kidney; H: Bone marrow (Same magnificence in A-H, ×400).