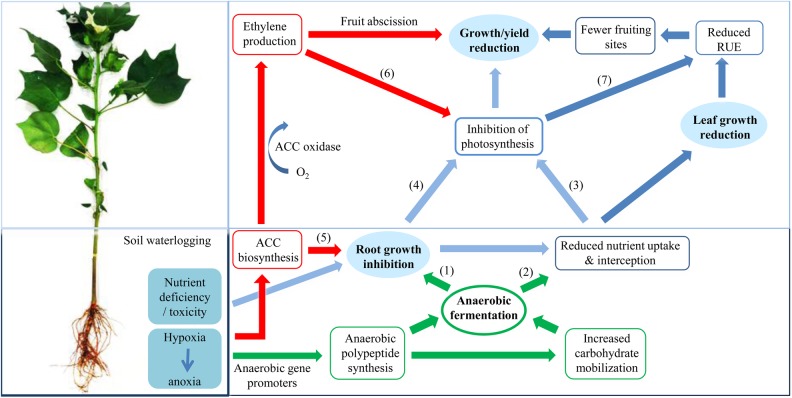
Figure 5.
Changes in cotton growth and yield in response to soil waterlogging. Flows are represented in four categories: green (biochemical pathway); red (hormonal/signalling pathway); light blue (physiological pathways); dark blue (morphological changes). (1) Lower ATP synthesis under O2 deficiency inhibits root growth (Armstrong and Drew 2002). (2) Reduced plasma membrane H+-ATPase activity impairs nutrient uptake and interception (Jackson et al. 2003). (3) Limited nutrient transport to leaf tissues damage chlorophyll and photosynthesis (Meyer et al. 1987). (4) Inhibited root growth acts as a negative feedback to photosynthesis by reducing the root carbohydrate demand (Benjamin and Greenway 1979). (5) Higher ACC concentration in root tissues could inhibit root growth (Leblanc et al. 2008). (6) Ethylene can influence ABA-induced stomatal dynamic and photosynthesis (Else et al. 2009). (7) Inhibited leaf photosynthesis in turn influence biomass accumulation, leaf size, canopy development and overall radiation-use efficiency (Guang et al. 2012).

