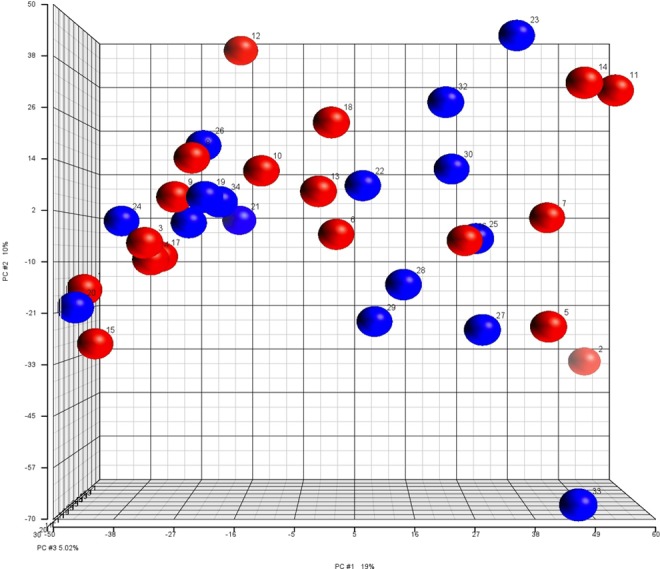
Figure 1.

Principal component analysis plot for expression of microRNA (miRNA) in umbilical cord blood. Red spheres represent controls with normal maternal BMI (BMI 20-24.9 at first prenatal visit). Blue spheres represent cases with maternal obesity BMI (BMI ≥ 35 kg/m2 at first prenatal visit). BMI indicates body mass index. (The color version of this figure is available in the online version at http://rs.sagepub.com/.)
