. 2015 Aug 20;12:E130. doi: 10.5888/pcd12.150103

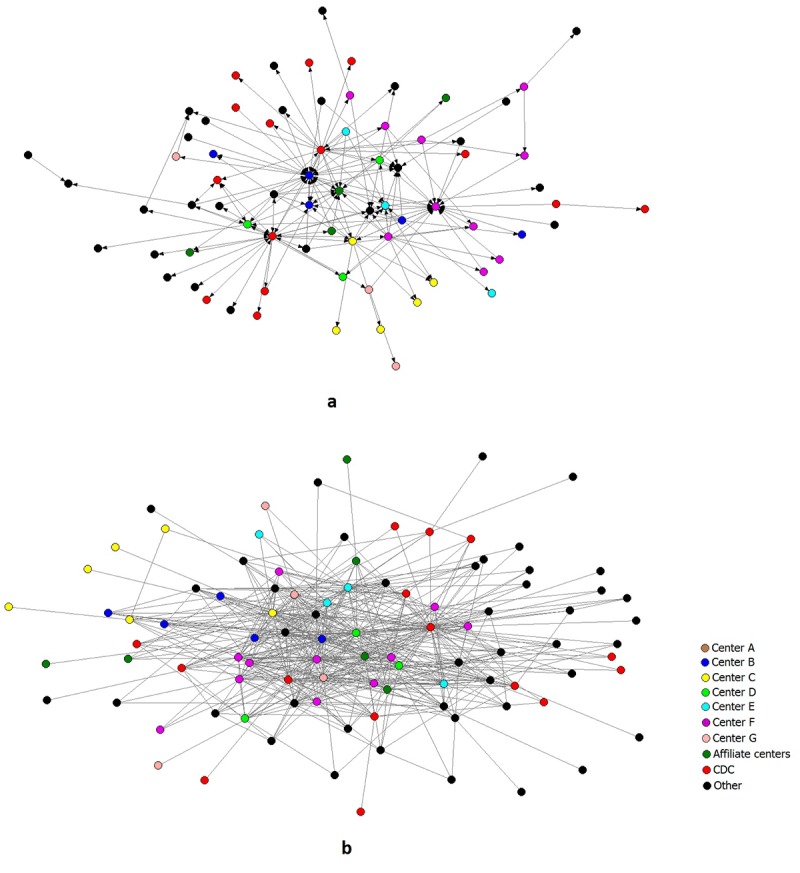
Figure 1.

Circles represent 97 individual members and partners (actors). Circle color indicates organizational affiliation to member centers and partner organizations. A line between 2 circles indicates that 1 or both actors reported the mentorship or collaboration tie between them. The lines in Figure 1a (approximately 150 lines) represent mentorship offered or received by the actors; the lines in Figure 1b (approximately 540 lines) represent collaboration on any kind of product.

Sociograms of the individual-level mentorship and collaboration networks of the Healthy Aging Research Network members and partners, United States, January 2014.