. 2015 Aug 20;12:E130. doi: 10.5888/pcd12.150103

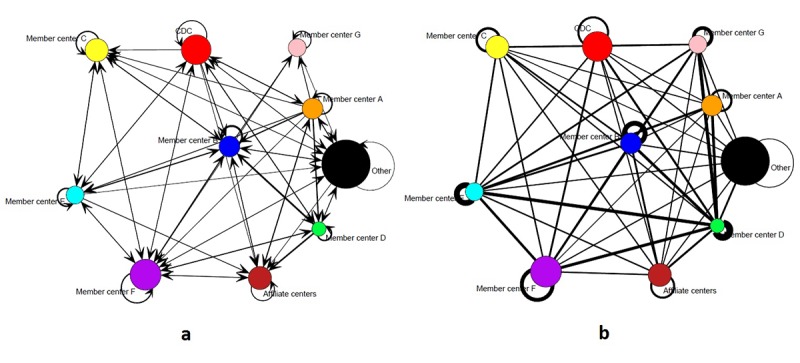
Figure 2.

Figure 2a shows 10 circles, 9 of which surround the center circle. Seven of the circles represent Member Centers A through G, and the remaining 3 represent affiliate centers: the Centers for Disease Control and Prevention and other aging organizations. Most circles are linked to all other circles through bidirectional arrows. These arrows have different widths that reflect the number of mentorship pairs between the 2 organizations. Some circles have self-ties, because mentorship can exist between members of the same organization. Figure 2b shows the same circles. All circles are connected to all other circles through simple lines. These lines also have different widths that reflect the number of collaboration pairs between the 2 organizations. All circles have self-ties, indicating that internal collaboration was observed for all organizations.

Sociograms of the mentorship and collaboration networks of the Healthy Aging Research Network members and partners aggregated at the organizational level, January 2014.