Figure 3.
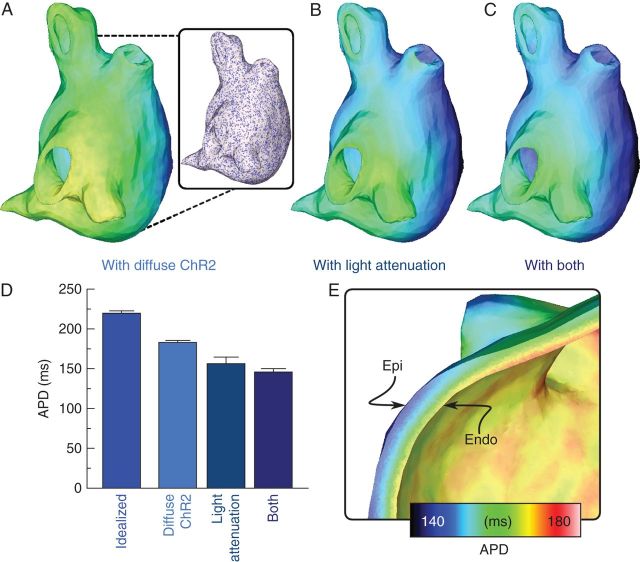
Effects of practical limitations on optogenetics treatment in the SQTS LA. (A–C) Left atrium repolarization times (same scale as Figure 2) in the light-treated LA in cases of non-uniform distribution of light-sensitive cells, the presence of light attenuation, or both. Inset in (A) shows the model-generated pattern of ChR2-expressing cells (purple) and normal myocytes (white). (D) Comparison of APDs (mean ± standard deviation) for cases shown in (A–C); APD for idealized light-treated case (Figure 2D) is also shown. (E) Cutaway view showing transmural APD gradients for the light-treated LA with representation of light attenuation (B).

