Figure 2.

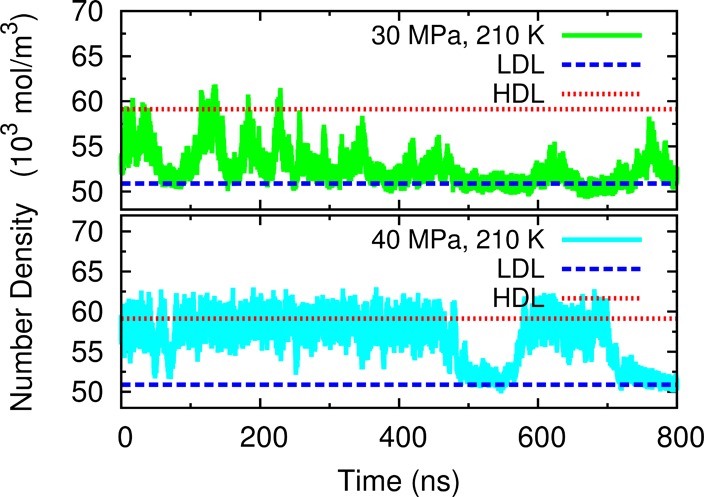
Time trace of the box density at 30 MPa 210 K (top) and 40 MPa 210 K (bottom). The horizontal lines are the expected density for HDL and LDL, respectively.

Time trace of the box density at 30 MPa 210 K (top) and 40 MPa 210 K (bottom). The horizontal lines are the expected density for HDL and LDL, respectively.