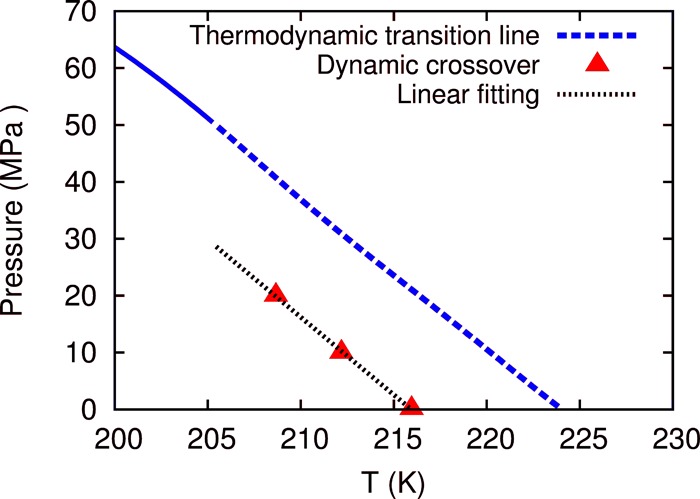
Figure 3.

Dynamic crossover line and the thermodynamic transition line. The thermodynamic transition line follows the phase-transition line (solid) below the critical temperature and the Widom line above the critical temperature (dashed). The dynamic crossover line ends at the critical point. Below the critical point, the viscosity becomes discontinuous when the phase boundary is crossed.
