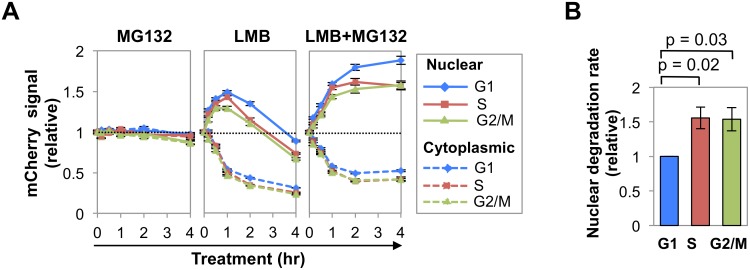
Fig 2. Nuclear AID is degraded more slowly in G1 phase than S-G2/M phases.
(A) Representative analysis of kinetics of response of AID-mCherry nuclear (solid lines) and cytoplasmic (dashed lines) signals to treatment with MG132, LMB or LMB + MG132 in G1, S and G2/M phase cells. This analysis was repeated 3 more times for LMB treatment (see S3 Fig), and once for MG132 and LMB+MG132 treatment. Each point represents a population average, and black bars represent SEM of the population, which are too small to discern. Dotted line represents no change (fold change of 1). (B) Relative rates of nuclear degradation of AID-mCherry in LMB-treated cells in G1, S and G2/M phases. Rates were estimated as the slope of the line defined by the population averages at 1 and 2 hr of treatment, in 4 independent experiments (Figs 2A and S3). Values are presented relative to the slope in G1 phase. SEM, black bars. Significance (p values) shown above graph were determined by two-tailed, unpaired Student’s t-test, assuming unequal variances.

