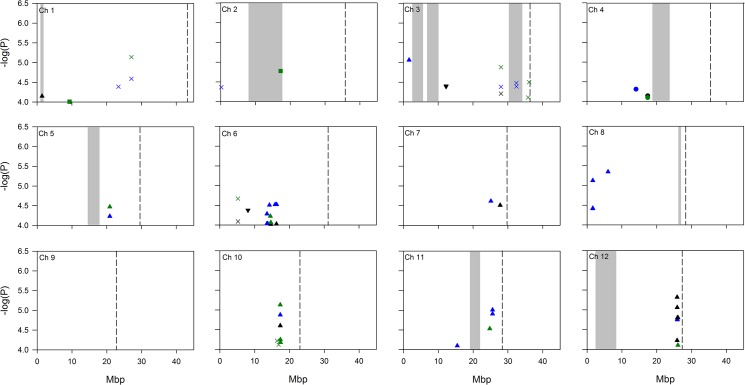
Fig 3. GWA mapping of germanium induced lesions across the 12 rice chromosomes.
Note the Y axis starts at 4, so only the most highly associated SNPs are represented. Data points are SNPs significantly associated (P<0.0001) with the trait and which have a MAF > 5%. Significant SNPs from different days are displayed with different coloured symbols: day 4 are black, day 5 are green, and day 6 are blue. Analyses of the combined subpopulation groups and separate subpopulations are represented by different symbols: combined analysis = X, aus = circle, indica = square, tropical japonica = triangle, temperate japonica = inverted triangle. Grey highlighted bars indicate regions of mapped QTLs for germanium induced lesions identified in this study. Dotted lines indicate chromosome ends.

