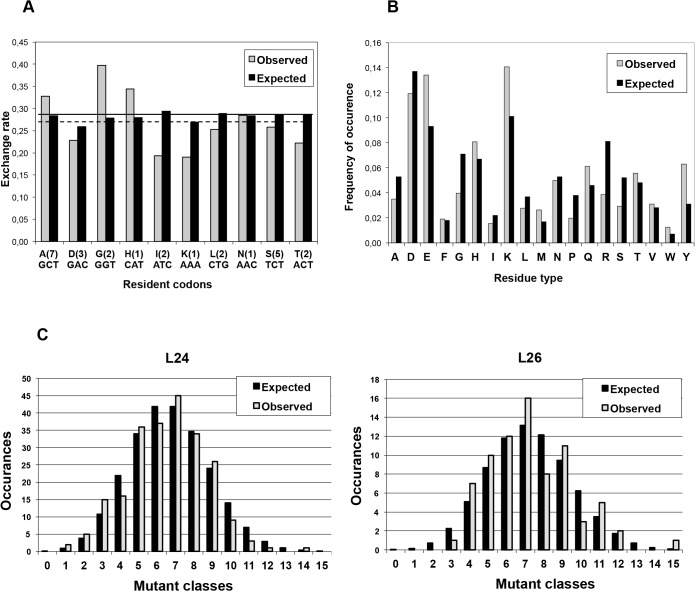
Fig 6. Library analysis.
(A) Exchange rate per type of resident amino acid. Comparison of the expected exchange probabilities (the fraction of foreign trimers in each trinucleotide mixture) with the observed exchange rate per type of resident codon (cumulative, sample size: 2762 exchanges). The number of resident amino acids among the 26 selected positions is indicated in parentheses, below is the respective codon. The differences in the expected exchange probabilities per type of residue are due to the biased composition of the trimer mix. The thick horizontal line indicates the average exchange probability (0.28), the dashed line–the average observed exchange rate (0.27). (B) Pertaining to replacing residues. Comparison of the expected frequency distribution of the amino acid exchanges (the molar ratio of each trimer in the trinucleotide mixture) with the observed frequency distribution for a sample of 2762 trinucleotide exchanges. (C) Binomial distribution of the number of mutations in L24 and L26. The observed distribution of the number of mutations per molecule (mutant class) is compared with the expected one (number of representatives in each mutant class for the given sample size = occurrences). The expected distribution of the mutant classes (L24: k = 1–24; L26: k = 1–26) is calculated according to the binomial distribution for a sample size of 239 sequences (L24) and 76 sequences (L26).

