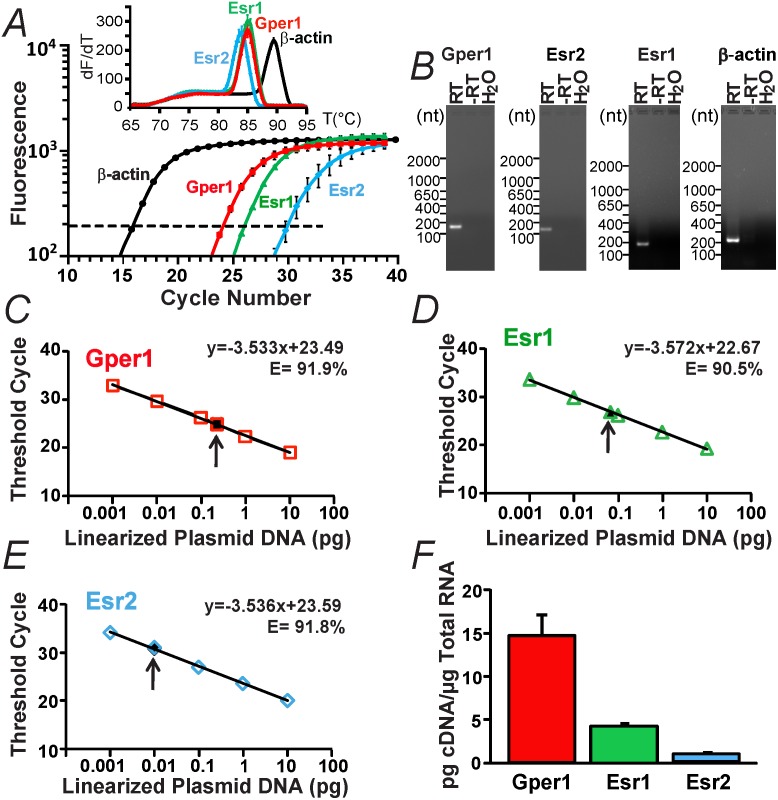
Fig 1. Gper1 transcripts predominate over Esr1 and Esr2 in male mouse heart.
A. An example of relative fluorescence intensity versus PCR cycle number for Esr1, Esr2, Gper1 and β-actin (housekeeping gene) in mouse ventricle. Inset, melting curves for Gper1, Esr1, Esr2, and β-actin reactions. B. Real-time PCR end-products for Gper1, Esr1, Esr2 and β-actin with reverse transcriptase (RT), without RT (-RT) and water instead of total RNA (H2O). C-E. Standard calibration curves for Gper1, Esr1, and Esr2 DNA plasmids, respectively. Open symbols, known amount of linearized plasmid DNA. Closed symbols, interpolated absolute values of estrogen receptor cDNAs in mouse heart (arrow). F. Mean absolute values of Gper1, Esr1 and Esr2 transcript levels in mouse heart. Quantifications were performed in duplicate from samples of three different animals (n = 3). In this and following figures, data were acquired from male mice.

