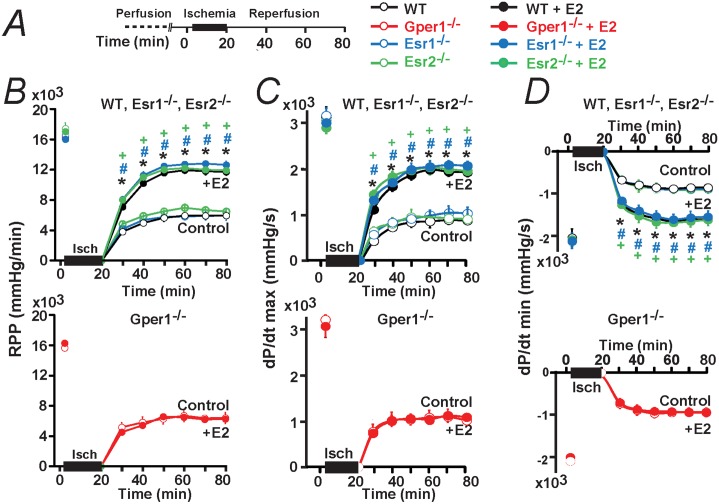
Fig 3. Time course of cardiac function after I/R in control and after E2 treatment in WT, Esr1-/-, Esr2-/- and Gper1-/-.
A. Ischemia/reperfusion (I/R) protocol used to perfuse mouse hearts isolated from WT, Esr1-/-, Esr2-/- and Gper1-/- male animals. B-D. Time course of Rate Pressure Product (RPP) (B), Maximum Velocity of Contraction (dP/dt max) (C) and Minimum Velocity of Relaxation (dP/dt min) (D). During the reperfusion period, E2 produced an improvement of all of the functional recovery parameters compared to control in WT, Esr1-/-, and Esr2-/- (B-D, top); however, E2 had no effect when using Gper1-/- hearts (B-D, bottom). Data points were obtained by averaging 2 min values before ischemia and every 10 min of reperfusion. Values are mean±SEM; * P<0.05 E2-treated versus control in WT; + P<0.05 E2-treated versus control in Esr2-/-, # P<0.05 E2-treated versus control in Esr1-/-. n = 6–8 hearts/ group.

