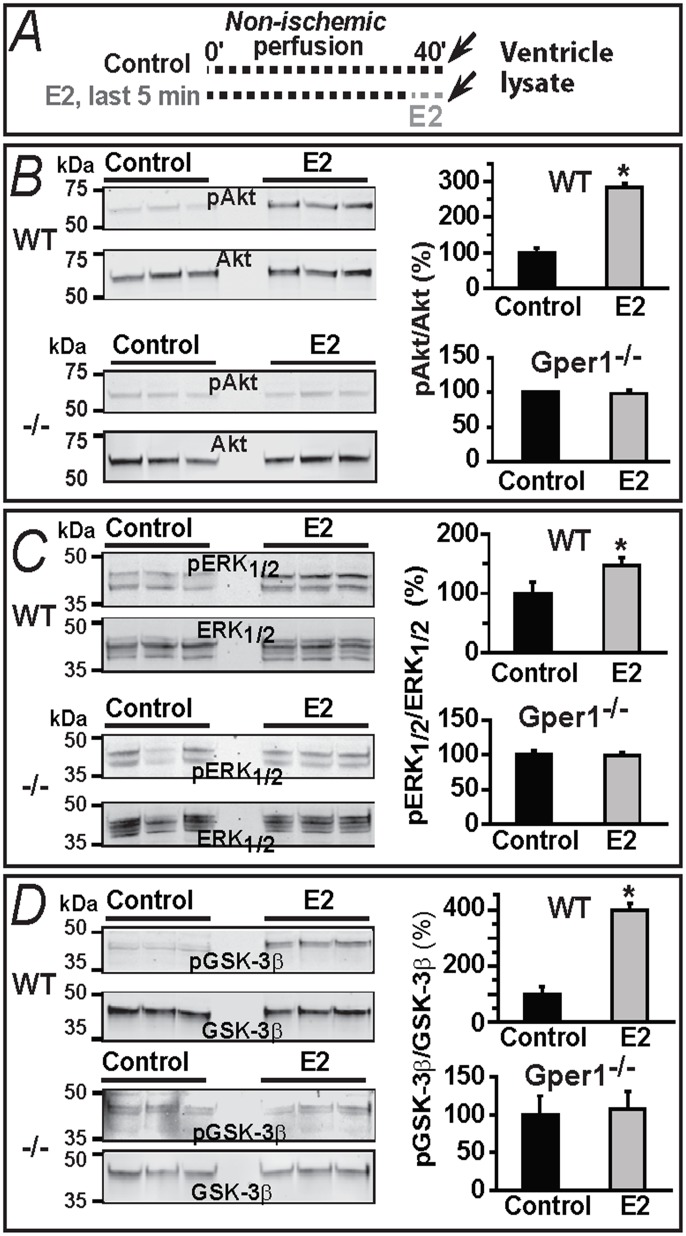
Fig 6. E2-induced increase in phosphorylation of Akt, ERK1/2 and GSK-3β is dependent on Gper1 gene expression and disappears with time for Akt and ERK1/2.
A. Protocol used in panels B,C,D. Isolated hearts were either perfused 40 min with oxygenated KH solution or perfused with oxygenated KH for 35 min and for 5 min with KH plus 40 nM E2. B-D. Immunoblots and corresponding bar graphs show that 5 min “pre-ischemic” treatment with E2 provoked pAkt/Akt, pERK1/2/ERK1/2 and pGSK-3β/GSK-3β ratios to increase in WT but not in Gper1-/- samples. Control ratios were set to 100%. Values are mean±S.E.M.; *, P<0.05 control versus E2-treated group, n = 7 hearts/group.

