
Fig 3. Comparison of the distribution of the number of crossovers.
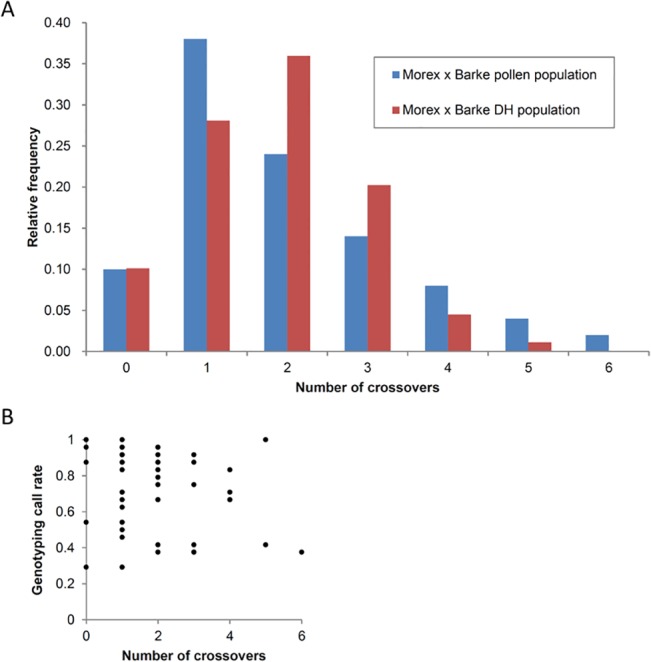
(A) The relative frequency of the total number of crossovers per chromosome 3H grouped into classes ranging from 0 to 6 of the Morex x Barke pollen population (blue) in comparison to the Morex x Barke DH population data (red) [17]. (B) Correlation between KASP genotyping call rate and the number of crossovers found for each sample (r = -0.16, r² = 0.03).