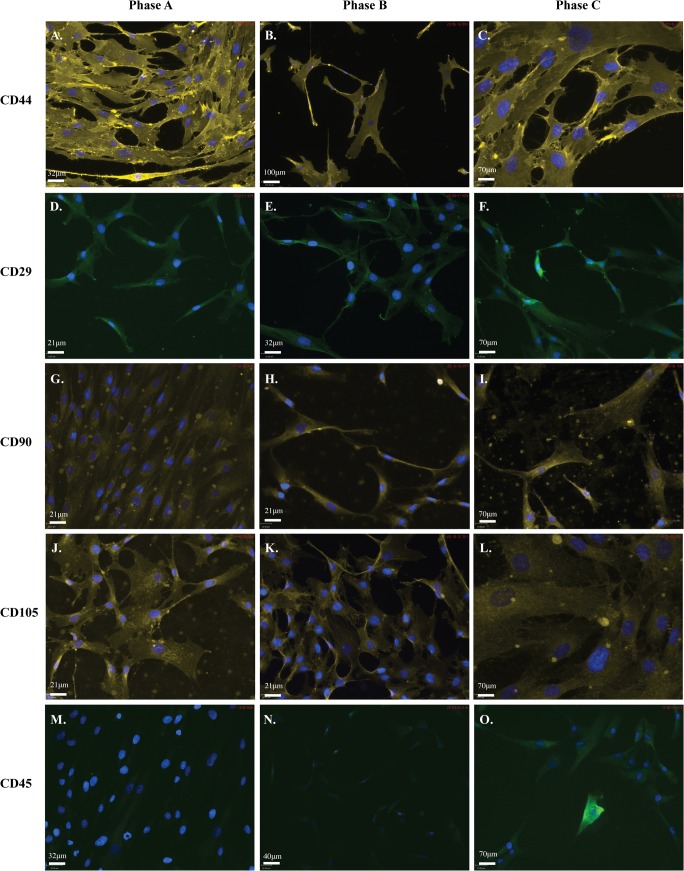
Fig 2. hMSC populations are positive for markers of MSC stemness.
ICC showing positive staining for each of the five markers used to confirm hMSC stemness. Each of three hMSC populations was stained for each marker at each phase of growth. Cells are positive for: A-C: goat anti-mouse-CD44 (1/1000); D-F: goat anti-rabbit-CD29 (1/200); G-I: goat anti-mouse-CD90 (1/500); J-L: goat anti-mouse-CD105 (1/500); and negative for M-O: goat anti-rabbit-CD45 (1/500) at Phase A, Phase B and Phase C. At Phase C populations also become positive for CD45. Secondary antibodies used were anti-mouse-Chromeo546 (yellow; 1/1000) and anti-rabbit-Chromeo488 (green; 1/1000). Cells were mounted in mounting media containing DAPI (blue) to counterstain nuclei. Scale bar represents 70μm.

