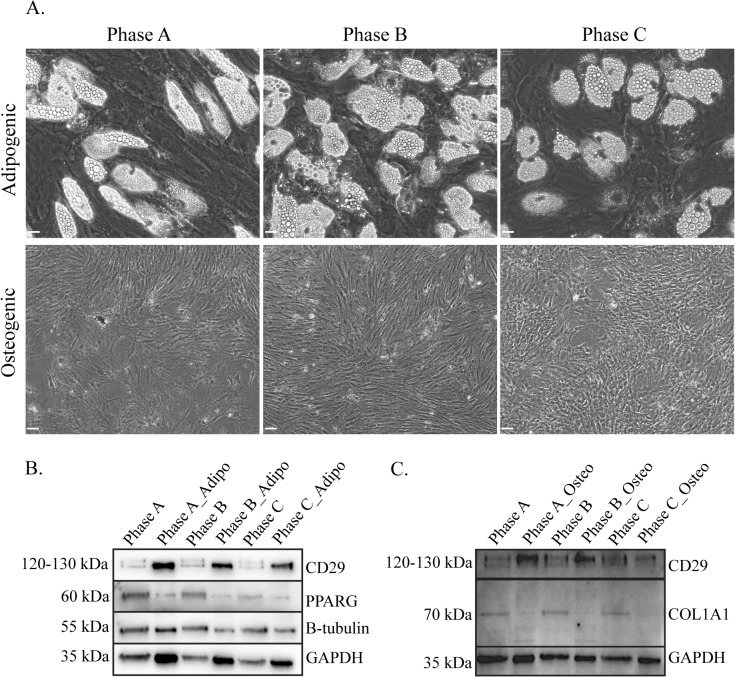
Fig 4. Adipogenic and osteogenic differentiation of MSCs at each passage during expansion.
A: Phase contrast images of differentiated adipogenic and osteogenic cultures showing phenotypic changes as well as lipid droplet accumulation and mineralisation of the cultures. WB analysis demonstrating protein detection of MSC markers CD29, PPARG and COL1A1 in undifferentiated hMSC at each growth phase in B: differentiated Adipogenic cultures and C: Osteogenic cultures. GAPDH was used as the loading control. Scale bar represents 60μm.

