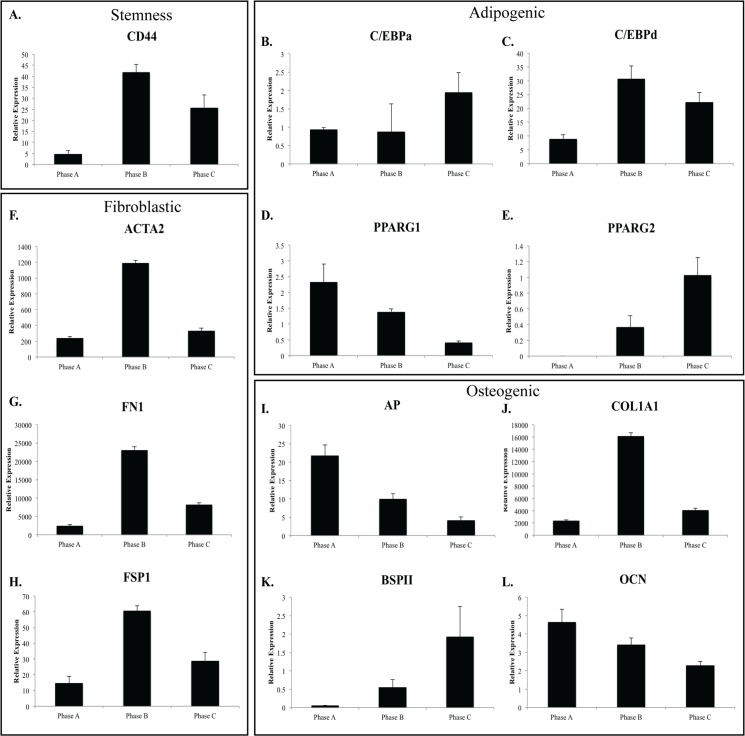
Fig 6. Relative gene expression of MSC lineage markers in hMSC populations throughout growth phases.
Relative gene expression changes for A: Stemness markers (CD44); lineage specific B-E: adipogenic (C/EBPa, C/EBPd, PPARG1/2); F-H: Fibroblastic (ACTA2, FN1, FSP1); and I-L: osteogenic (AP, COL1A1, BSPII, OCN) in hMSCs (n = 3) at each passage. The majority of genes examined (lineage and stemness) increased expression at Phase B followed by decreased expression by Phase C (ACTA2, CD44, C/EBPd, COL1A1, FN1, FSP1). In contrast, lineage specific markers osteocalcin; OCN, Alkaline Phosphatase; AP and PPARG1 demonstrated decreased expression throughout expansion with bone sialoprotein II; BSPII, C/EBPa and PPARG2 demonstrated increased expression throughout expansion.

