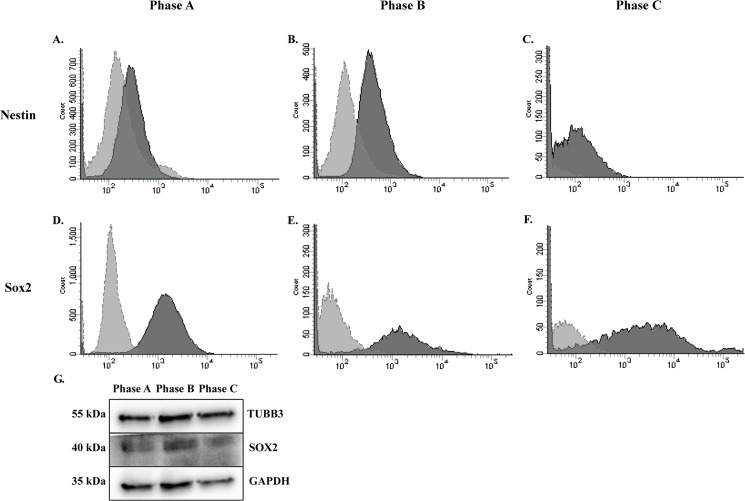
Fig 9. Neural marker proteins examined by FACS and WB in MSCs during expansion.
Positive expression of neural markers is demonstrated. A-C: Populations average more than 30% positive for the neural stem cell marker, Nestin; and D-F: more than 50% positive for Sox2. Variation was observed between populations in percentages of the population positive for each maker, with the greatest variation seen at Phase B. Dark grey histogram is marker of interest. Light grey histogram is secondary antibody only control. G: Neural proteins TUBB3 and SOX2 were detected in undifferentiated hMSCs by WB during expansion.

