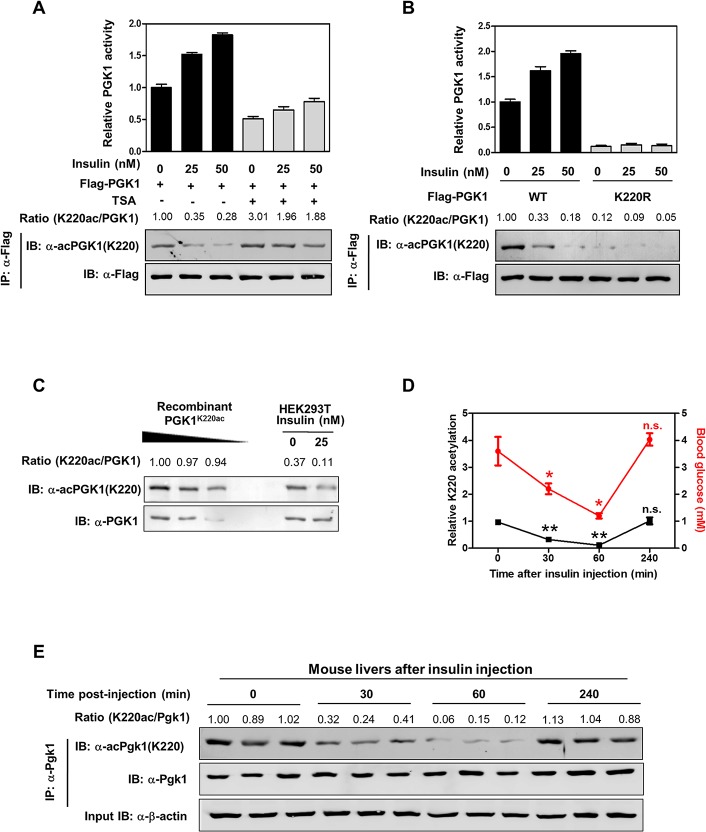
Fig 4. Insulin promotes K220 acetylation to stimulate PGK1 activity.
(A) TSA treatment blocks the effect of insulin on changing PGK1 K220 acetylation and enzyme activity. Flag-tagged PGK1 was ectopically expressed in HEK293T cells treated with increased concentrations of insulin as indicated, and these cells were co-treated with or without TSA (5 μM for 12 hr). PGK1 proteins were purified by Flag beads. The K220 acetylation levels and enzyme activity were determined by western blot analysis and enzyme assay, respectively. Relative K220 acetylation levels were normalized against Flag. (B) K220R mutant PGK1 displays a negligible response in changing K220 acetylation and enzyme activity upon insulin treatment. Flag-tagged wild-type or K220R mutant PGK1 were transiently overexpressed in HEK293T cells treated with increased concentrations of insulin as indicated. PGK1 proteins were purified by Flag beads. The K220 acetylation levels and enzyme activity were determined by western blot analysis and enzyme assay, respectively. Relative K220 acetylation levels were normalized against Flag. (C) Quantification of the percentage of K220 acetylated endogenous PGK1 in HEK293T cells. Recombinant fully K220 acetylated PGK1 was loaded onto the same gel, together with endogenous PGK1 from HEK293T cells treated without or with insulin (25 nM, 2 hr). PGK1 protein and K220 acetylation were detected by western blot. Relative PGK1 K220 acetylation levels were normalized against endogenous PGK1. (D, E) Quantification of the percentage of K220 acetylated endogenous Pgk1 in mouse livers. Insulin (5 U/kg) was intraperitoneally injected into wild-type mice, and blood glucose levels were measured at the indicated time points after injection. Mouse livers were harvested at the indicated time points post injection, and the K220 acetylation levels of endogenous Pgk1 were determined by western blot. Relative Pgk1 K220 acetylation levels were normalized against endogenous Pgk1. Shown are average values with standard deviation (S.D.) of triplicated experiments. * denotes p < 0.05 and ** denotes p < 0.01 versus t = 0 (before injection); n.s. = not significant. The numerical data and statistical analysis used in the figures are included in S1 Data. Supporting information can be found in S6 Fig.

