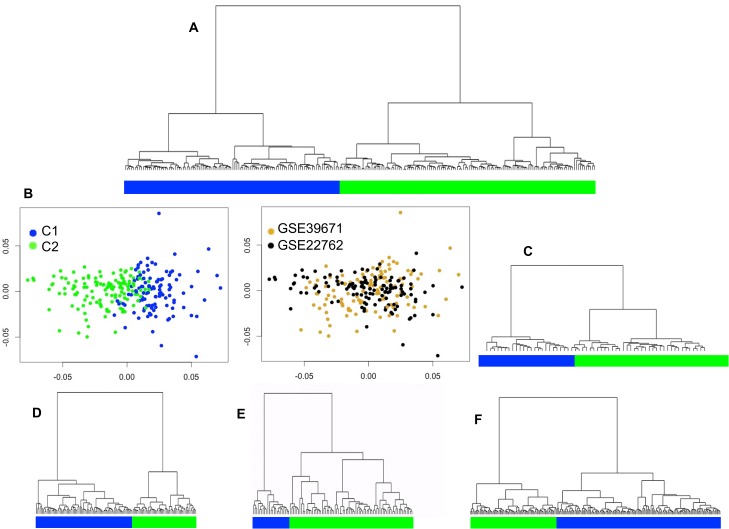
Fig 3. CLL sample clustering showing the primary transcriptional subgroups.
Dendrogram obtained by hierarchical clustering of different cohorts. A. Merged dataset. B. Multidimensional scaling of the merged data; the left panel shows evidence of two clusters, and the right panel shows the two individual cohorts after sample merging. However, some sample overlap between groups was evident. C. Cohort GSE38611. D. Cohort GSE9992. E. Cohort GSE2466. F. Cohort GSE46261.

