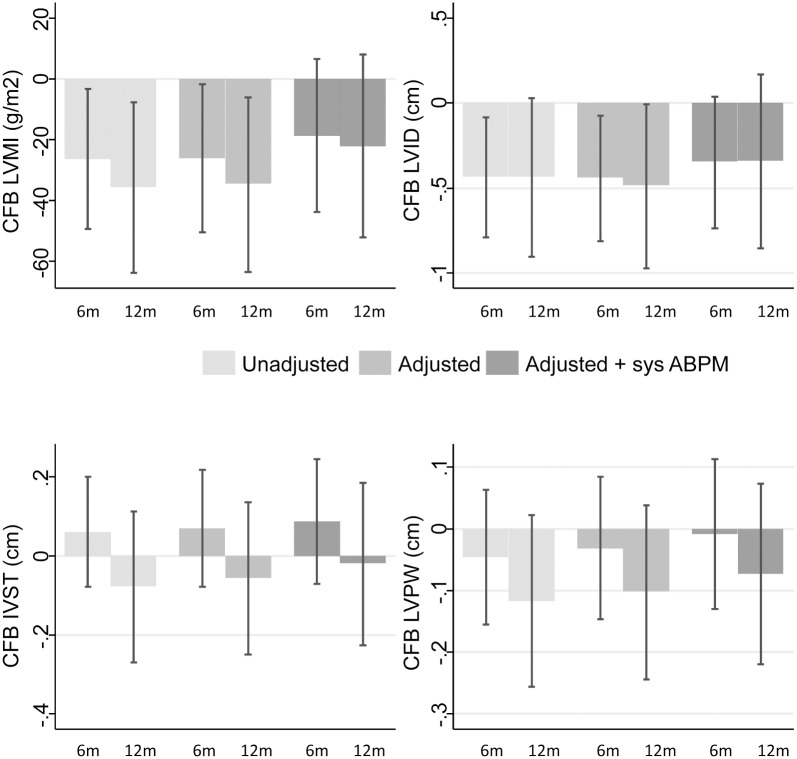
Fig 1. Treatment-induced change in left ventricular mass index and in cavitary and muscular components of left ventricle.
The Y-axis shows the change from baseline (CFB) to 6 and 12 months of treatment in a) left ventricular mass index (LVMI); b) left ventricular internal diameter (LVID); c) interventricular septal thickness (IVST); and d) left ventricular posterior wall thickness (LVPWT). The x-axis shows the months of treatment. Shades of the bars represent progressive adjustments to the models with the darker bar representing the full-adjusted models. The error bars represent 95% confidence intervals of the means derived from mixed linear model analysis. In unadjusted analysis, LVMI and LVID were significantly reduced from baseline to 6 and 12 months in contrast to IVST and LVPWT that remained unchanged. After adjustment for age, gender, race, smoking, diabetic status, history of previous cardiovascular disease, hemoglobin levels, treatment arm and drug effect over time, CFB to 6 and 12 months in LVMI and LVID remained significant; however, additional adjustment for the CFB in 44-hour ambulatory systolic blood pressure or IVC diameter mitigated the reduction in LVMI and LVID. IVST and LVPWT remained constant during follow-up in both adjusted models.

