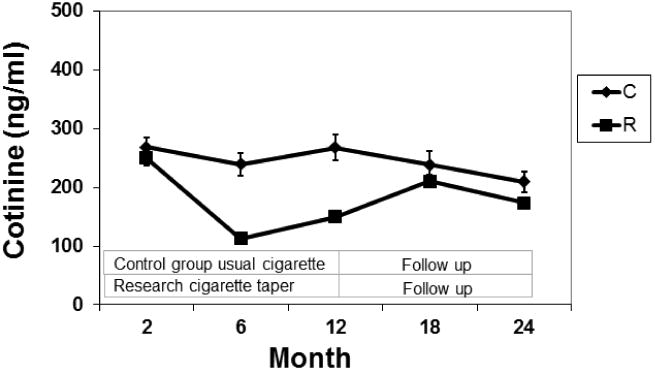
Fig. 4. Plasma Cotinine by Group.

Mean plasma cotinine concentration over 24 months of the study in smokers smoking their usual brand of cigarettes (C) or during progressive reduction of nicotine content of cigarettes (R). The bars represent SEM.

Mean plasma cotinine concentration over 24 months of the study in smokers smoking their usual brand of cigarettes (C) or during progressive reduction of nicotine content of cigarettes (R). The bars represent SEM.