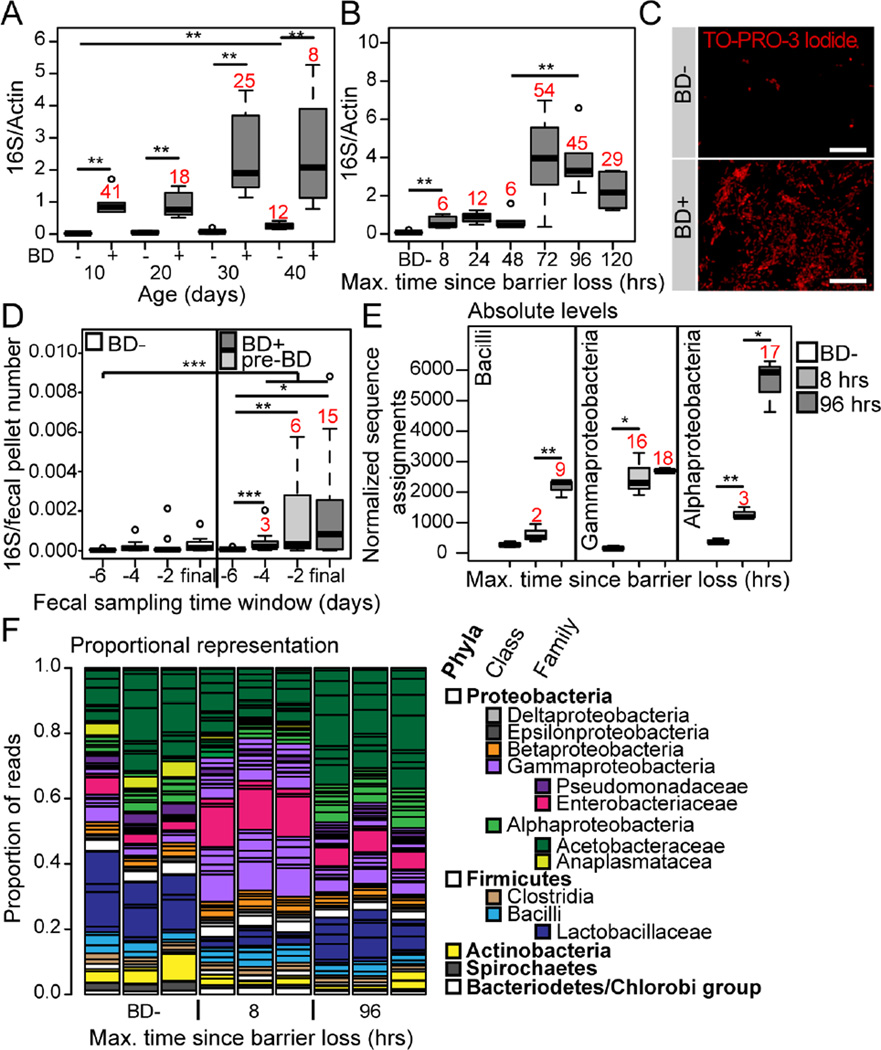
Figure 1. Alterations in microbiota composition are linked to age-onset intestinal barrier dysfunction.
(A and B) Bacterial levels assayed by qPCR of the16S ribosomal RNA gene in dissected intestines from Smurfs (BD+), and non-Smurf controls (BD-), at 10 day intervals to day 40 (A), and during a time course following barrier dysfunction at day 30 (B). n = 6 replicates of 5 dissected intestines. Numbers in red indicate fold change of the median compared to the relevant BD- control. (C) Representative images of bacteria visualized by TO-PRO-3 DNA stain in the posterior midgut lumen of BD- or 5 day post-BD+ (red channel, TO-PRO-3 DNA stain; scale bar represents 10 µm). (D) Time-series data of 16S qPCR in fecal samples of individual 40–50 day old flies, grouped as BD- or pre-BD+ depending on their phenotype during the first 24 hours of the final 48 hour sampling window. n = 12–14 individuals. Numbers in red indicate fold change of the median compared to the −6 pre-BD time point. (E) Normalized number of sequence assignments at the class taxonomic level in 8 and 96 hours post-BD+, and BD−. Only the most abundant groups are shown. n = 3 replicates of 5 dissected intestines at day 30. Numbers in red indicate fold change of the median compared to the relevant BD- control. (F) Proportional sequence assignments for BD-, 8 and 96 hours post-BD+. Each column represents a biological replicate. Horizontal black lines separate the taxonomic units, major groups are color-coded, the legend shows color assignments and taxonomic hierarchy. n = 3 replicates of 5 dissected intestines from day 30. All in w1118 females. BD- = non-Smurf, BD+ = post-Smurf. Boxplots display the first and third quartile, with the horizontal bar at the median. * p<0.05, ** p<0.01, *** p<0.001. Wilcoxon test for panels A, B and D, t-test for panel E.

