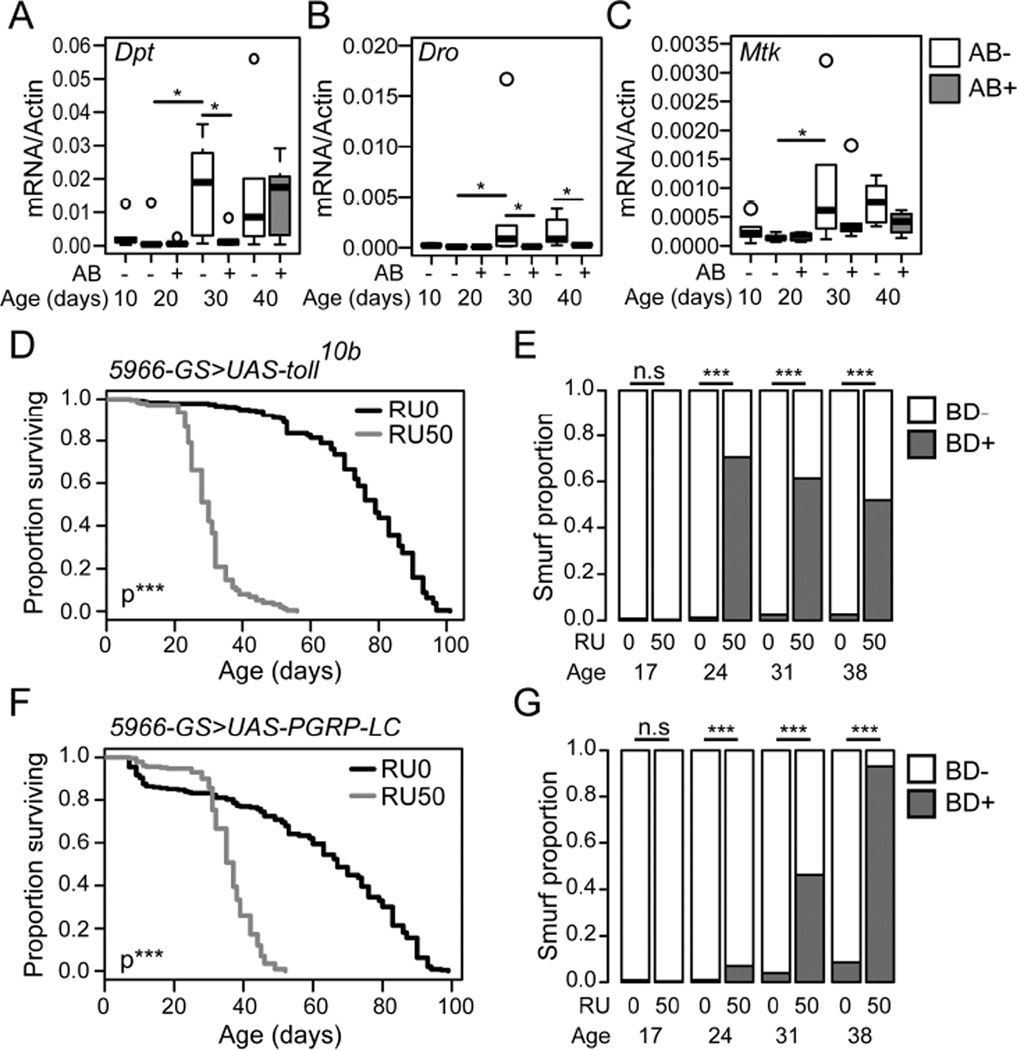
Figure 3. Intestinal immune activation shortens life and induces intestinal barrier dysfunction.
(A–C) Antimicrobial gene expression assayed at 10 day intervals by qPCR from dissected intestines of untreated (AB-) or antibiotic treated (AB+) w1118 female non-Smurfs. Antibiotic feeding was from 10 days of age. n = 6 replicates of 5 intestines. Diptericin (Dpt) (A), Drosocin (Dro) (B), Metchnikowin (Mtk) (C). (D–G) Lifespan curves (D and F) and Smurf proportions (E and G) in UAS-Toll10b/5966-Geneswitch (D and E) and UAS-PGRP-LC/5966-Geneswitch (F and G) female flies drug induced from day 10 of adulthood (RU50), and uninduced controls (RU0). n = >200 flies/condition. BD- = non-Smurf, BD+ = Smurf. Boxplots display the first and third quartile, with the horizontal bar at the median. * p<0.05, ** p<0.01, *** p<0.001. Log Rank test for survival data in panels D and F, Binomial test for Smurf proportions in panels E and G, Wilcoxon test for other data.

