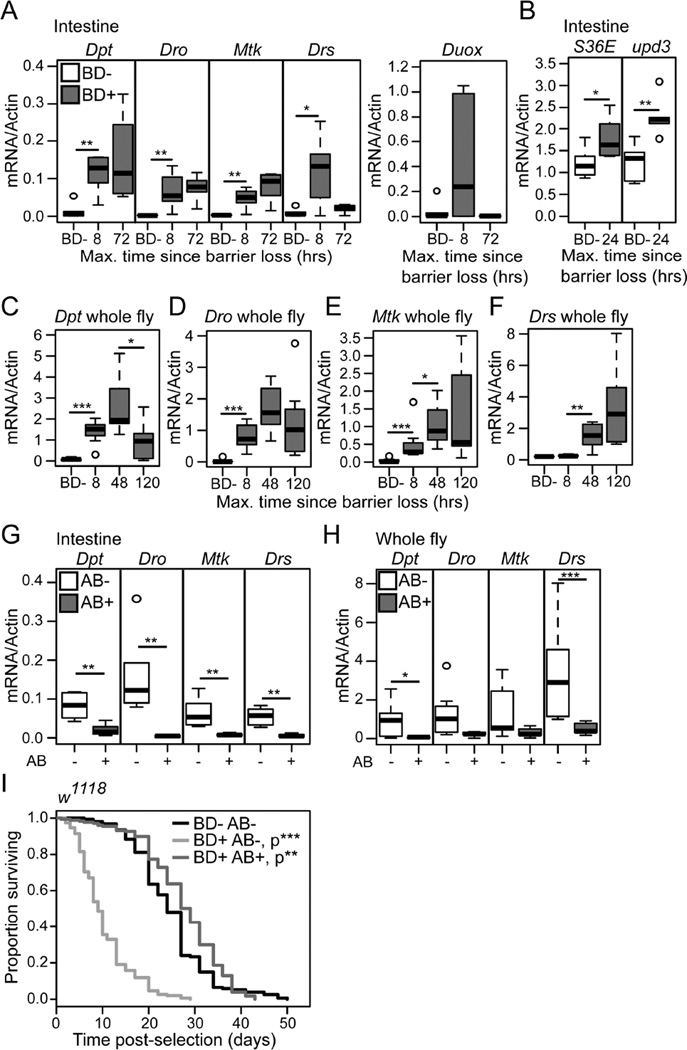
Figure 6. Preventing dysbiosis post-intestinal barrier dysfunction restores lifespan.
(A and B) Gene expression assayed by qPCR from dissected intestines of non-Smurfs (BD-) and at multiple time-points post-Smurf (BD+). n = 6 replicates of 5 intestines. (C–F) Gene expression assayed by qPCR from whole BD-, 8, 48 and 120 hours post-BD+ flies. n = 6 replicates of 3 whole flies. (G and H) Antimicrobial gene expression assayed by qPCR from dissected intestines (G) or whole fly (H) of antibiotic treated and untreated 5 day post-BD+ flies. n = 6 replicates of 5 intestines, or 3 whole flies. (I) Survival curves of antibiotic treated and untreated 24 hour post-BD+ flies, and age-matched untreated BD- controls. n = >200 flies/condition. P values are compared to BD- controls. Dpt -Diptericin, Dro - Drosocin, Mtk - Metchnikowen, Drs - Drosomycin, Duox – Dual Oxidase. upd3 – unpaired 3, Socs36E – Suppressor of cytokine signaling at 36E. All flies were scored BD- or BD+ between 30–35 days old. All in w1118 female flies. Antibiotic treatment from 24 hours post-BD+. BD- = non-Smurf, BD+ = Smurf. Boxplots display the first and third quartile, with the horizontal bar at the median. * p<0.05, ** p<0.01, *** p<0.001, Log Rank test for survival data in panel I, Wilcoxon test for other data.

