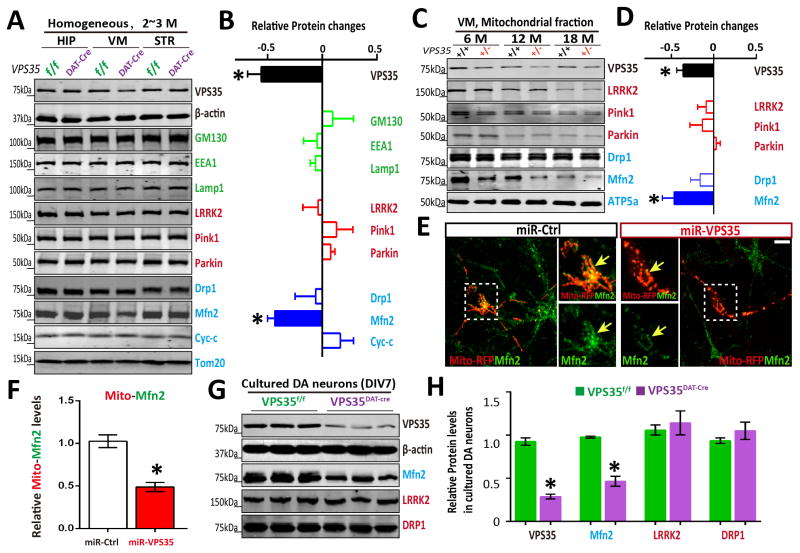
Figure 2. Reduced mitochondrial MFN2 in Vps35-deficient DA neurons.
(A–B) Reduced MFN2 in Vps35DAT-Cre VM (ventral midbrain), but not HIP (hippocampus) or STR (striatum). Soluble extracts from HIP, VM and STR of indicated mice were subjected to Western bot analysis. A, Representative blots; B, Quantification of protein levels (compared with Vps35f/f controls). Data presented were mean ± SEM (n = 3 mice/genotype); *p < 0.05. (C–D) Reduced mitochondrial MFN2 in aged Vps35+/− VM. Mitochondrial fractions of indicted mice were subjected to Western bot analysis. C, Representative blots; D, Quantification of protein levels (compared with Vps35+/+ controls); Data presented were mean ± SEM (n = 3 mice/genotype); *p < 0.05. (E–F) Reduced mitochondrial MFN2 in miRNA-Vps35 expressing neurons. E, Representative images of transfected neurons; F, Quantitative data (normalized by control miR) (mean ± SEM; n = 5 neurons; *p < 0.05). (G–H) Reduced MFN2 levels in Vps35DAT-Cre primary DA neurons. G, Representative blots; H, Quantification of protein levels (normalized with Vps35f/f controls). Data presented were mean ± SEM (n = 3 mice/genotype); *p < 0.05.

