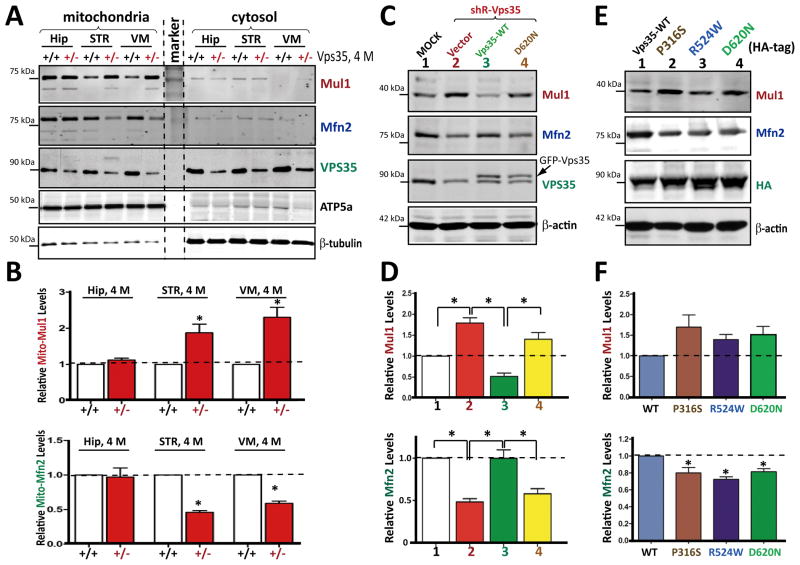
Figure 5. Increased MUL1 in VPS35+/− midbrains and in SH-SY5Y cells expressing shRNA-VPS35 or PD-linked VPS35 mutants.
(A–B) Increased mitochondrial-MUL1 protein in 4-M old VPS35+/− VM and STR, but not Hip. Mitochondrial fractions were subjected to Western blotting with indicated antibodies. A, Representative blots; B, Quantification of data (normalized by VPS35+/+ control). (C–D) Association of increased MUL1 with decreased MFN2 in shRNA-VPS35-expressing SH-SY5Y cells, which was restored by expressing shRNA-resistant VPS35-WT, but not VPS35-D620N. C, Representative blots; D, Quantification of MUL1 and MFN2 protein (normalized by Mock control). (E–F) Association of increased MUL1 with decreased MFN2 in SH-SY5Y cells expressing PD-linked VPS35 mutants. E, Representative blots; F, Quantification of MUL1 and MFN2 protein levels (normalized by VPS35-WT control). Data in B, D, and F are presented as mean ± SEM (n = 3; *p < 0.05).

